Ethereum (ETH/USD) was on the defensive early in today’s North American session as the pair depreciated to the 387.55 area after trading as high as the 411.97 area during the Asian session, just below the 412.51 area that represented a relative low during a pullback on 16 August. The weaker short-term bias also became evident when the pair failed to breach the 413.52 area last night, representing the 50% retracement of the recent depreciation from 447.50 to 379.53. If the recent weakness persists, it could open up a test of downside retracement levels including the 376.90, 364.33, and 360.23 areas. Traders are also paying close attention to the 384.36 and 383.91 areas during the pair’s current pullback, representing the 76.4% and 78.6% retracements of the recent short-term appreciation from 379.53 to 400.00. Stops were elected below the 398.91, 397.08, 396.37, 392.67, 386.63, 384.29, and 382.47 areas during the pair’s recent depreciation from the 447.50 area. Following the pair’s recent depreciation from the 447.50 level to the 379.53 area, traders are eyeing upside retracement levels around the 395.57, 405.49, 413.52, 421.54, and 431.46 areas. The 396.69 area remains an important technical level, representing the 23.6% retracement of the historical depreciation from 1419.96 to 80.60. Following the pair’s prior run-up, important technical levels include the 414.17, 396.12, 392.67, 383.53, 376.90, 363.13, and 358.75 areas. Recently, the pair has encountered buying pressure around the 23.6% retracement of the appreciating range from 268.39 to 415.00, and downside retracement levels in this appreciating range include the 373.89, 364.70, 355.50, 344.13, and 342.42 areas.
Afte recently taking out the 445.45 level, one upside price objective is the 454.79 areas. Stops were recently elected above the 336.10, 337.33, 342.29, 350.44, 354.22, 366.48, and 369.26 areas during the move higher. Recently, bids emerged just above the 314.07 area, a level that represents the 50% retracement of the broad historical depreciation from the 547.54 to 80.60. A couple of interesting levels that traders will observe during retracements lower include the 301.20 and 301.40 areas, and they are related to buying pressure that emerged around the 241.62 and 319.86 areas. Likewise, the 312.82, 316.32, and 322.16 levels are areas with important technical significance. Chartists are observing that the 50-bar MA (4-hourly) is bearishly indicating below the 100-bar MA (4-hourly) and above the 200-bar MA (4-hourly). Also, the 50-bar MA (hourly) is bearishly indicating below the 200-bar MA (hourly) and above the 100-bar MA (hourly).
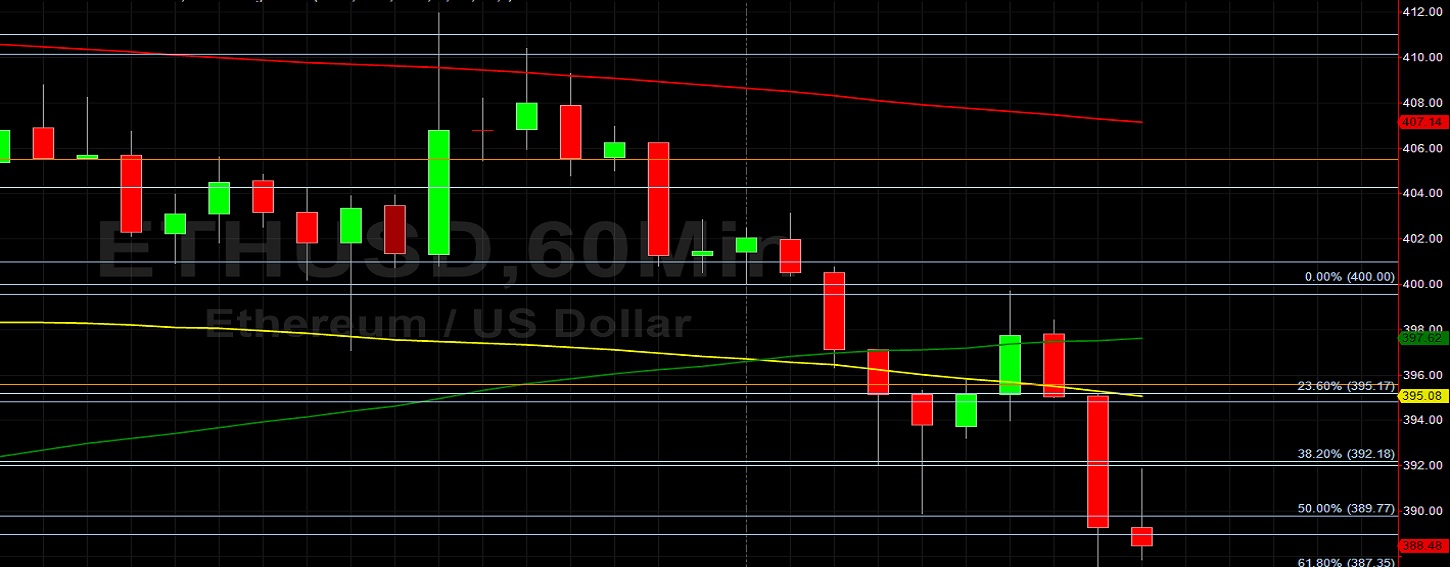
Price activity is nearest the 200-bar MA (4-hourly) at 376.54 and the 100-bar MA (Hourly) at 395.08.
Technical Support is expected around 349.75/ 331.95/ 315.08 with Stops expected below.
Technical Resistance is expected around 454.79/ 487.55/ 498.68 with Stops expected above.
On 4-Hourly chart, SlowK is Bullishly above SlowD while MACD is Bearishly below MACDAverage.
On 60-minute chart, SlowK is Bearishly below SlowD while MACD is Bearishly below MACDAverage.