Ethereum (ETH/USD) appreciated early in today’s North American session as the pair gained ground to the 392.84 area after trading as low as the 366.34 area during the Asian session. Traders appeared poised to again challenge the psychologically-important 400.00 figure following the pair’s recent spike to the 415.00 area over the weekend, a move that represented a test of the 418.79 level, representing the 61.8% retracement of the historical depreciation from 627.83 to 80.60. ETH/USD then quickly plunged to the 325.75 area, right around the 50-bar simple moving average on 4-hourly charts, and just above the 50% retracement of the recent appreciation from 229.77 to 415.00. Additional upside price objectives include the 425.31, 437.31, and 454.79 areas. Stops were recently elected above the 336.10, 337.33, 342.29, 350.44, 354.22, 366.48, and 369.26 areas during the move higher.
Following the pair’s recent run-up, traders are observing retracement levels around the 373.47, 371.29, 367.84, 360.65, 358.70, 347.82, 344.24, 338.66, 338.30, 331.95, 329.55, 323.87, 322.39, and 315.08 levels. Last week, bids emerged just above the 314.07 area, a level that represents the 50% retracement of the broad historical depreciation from the 547.54 to 80.60. A couple of interesting levels that traders will observe during retracements lower include the 301.20 and 301.40 areas, and they are related to buying pressure that emerged around the 241.62 and 319.86 areas. Likewise, the 312.82, 316.32, and 322.16 levels are areas with important technical significance. Chartists are observing that the 50-bar MA (4-hourly) is bullishly indicating above the 100-bar MA (4-hourly) and above the 200-bar MA (4-hourly). Also, the 50-bar MA (hourly) is bullishly indicating above the 100-bar MA (hourly) and above the 200-bar MA (hourly).
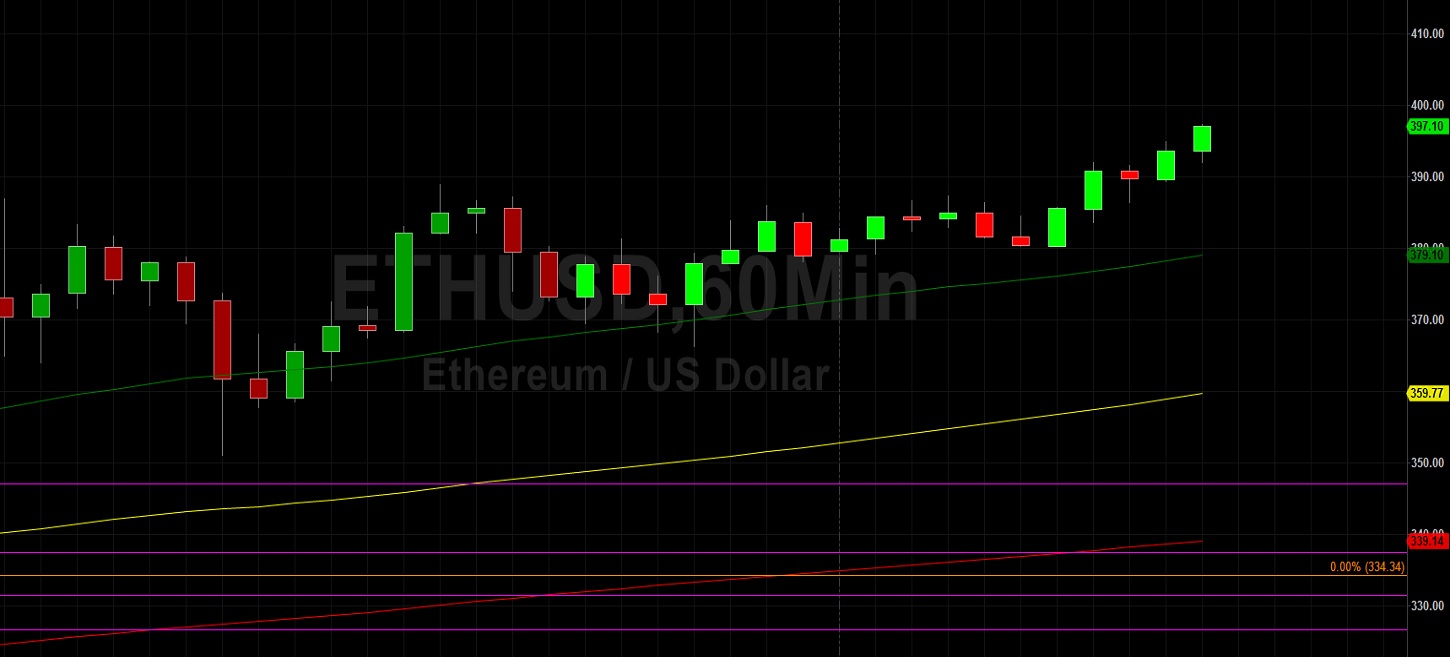
Price activity is nearest the 50-bar MA (4-hourly) at 340.21 and the 50-bar MA (Hourly) at 379.08.
Technical Support is expected around 305.98/ 293.26/ 281.92 with Stops expected below.
Technical Resistance is expected around 425.31/ 437.31/ 454.79 with Stops expected above.
On 4-Hourly chart, SlowK is Bullishly above SlowD while MACD is Bullishly above MACDAverage.
On 60-minute chart, SlowK is Bullishly above SlowD while MACD is Bullishly above MACDAverage.