Bitcoin (BTC/USD) sought to extend recent gains early in today’s Asian session as traders remained eager to push the pair back above the 12000 figure after the pair climbed to the 12086.22 area during yesterday’s Asian session. Recently, the pair traded as high as the 12134.29 area, so traders are curious to see if upward momentum will result in a new relative recent high being established. BTC/USD came off to the 11470.01 area during yesterday’s European session and found some bids around the 11717.44 area, just above the 23.6% retracement of a historical appreciation from 4680.65 to 13878.40. Some selling pressure then emerged around the 11983.26 area during yesterday’s North American session, a test of the 11992.15 area that represents the 38.2% retracement of the appreciation from 8940.14 to 13878.67. Traders remain focused on the 11395.78, 11372.38, 11350.94, and 11307.97 areas during pullbacks lower, representing the 23.6% retracements of the recent appreciating ranges that commenced around the 9005.00, 8905.84, 8815.01, and 8632.93 areas. A key level where buying pressure recently emerged is around the the 11529.38 level, a test of the 11510.44 area that represents the 50% retracement of a historical depreciation from 19891.99 to 3128.89. Traders recently drove BTC/USD as high as the 12134.29 area before profit-taking pushed the pair lower to the 10546.15 area, just above the 50% retracement of the same appreciating range from 8905.84 to 12134.29.
Additional upside price objectives include the 12227.83, 12268.47, 12311.39, 12859.49, and 13107.05 levels, targets related to areas of buying pressure that emerged earlier this year around the 3858.00 area and above. Stops were recently elected above the 11026.97, 11115.62, 11340.92, 11399.17, 11407.81, 11570.81, and 11761.97 levels. Following the pair’s recent appreciation to the 12134.29 level, traders are observing retracement levels around the 11395.78, 11350.94, 11307.97, 10938.90, 10866.33, 10796.77, 10651.81, 10569.65, 10474.65, 10383.61, and 10316.39 areas. Below those areas, some potential areas of technical support include the 10200.39, 10139.11, and 10082.97 areas. Chartists are observing that the 50-bar MA (4-hourly) is bullishly indicating above the 200-bar MA (4-hourly) and above the 100-bar MA (4-hourly). Also, the 50-bar MA (hourly) is bullishly indicating above the 100-bar MA (hourly) and above the 200-bar MA (hourly).
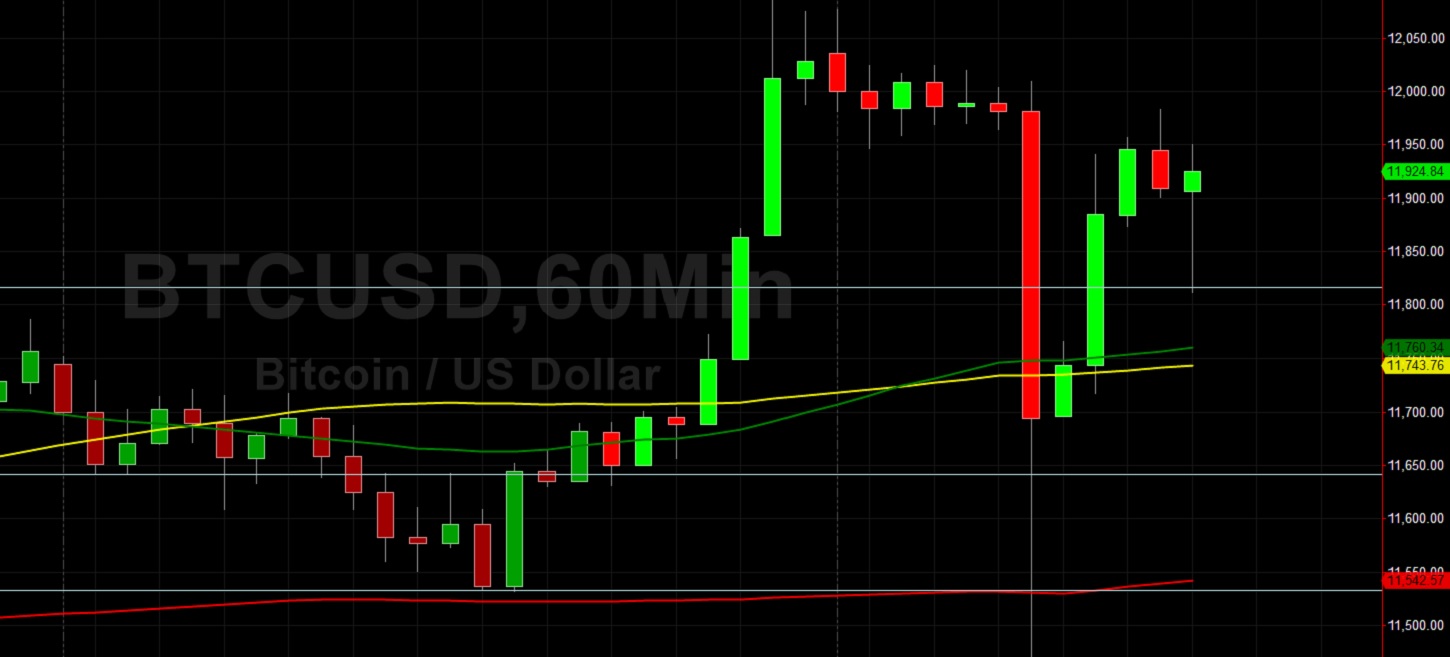
Price activity is nearest the 50-bar MA (4-hourly) at 11542.00 and the 50-bar MA (Hourly) at 11760.19.
Technical Support is expected around 11357.46/ 11249.01/ 11073.70 with Stops expected below.
Technical Resistance is expected around 12268.47/ 12311.39/ 13488.49 with Stops expected above.
On 4-Hourly chart, SlowK is Bearishly below SlowD while MACD is Bullishly above MACDAverage.
On 60-minute chart, SlowK is Bullishly above SlowD while MACD is Bearishly below MACDAverage.