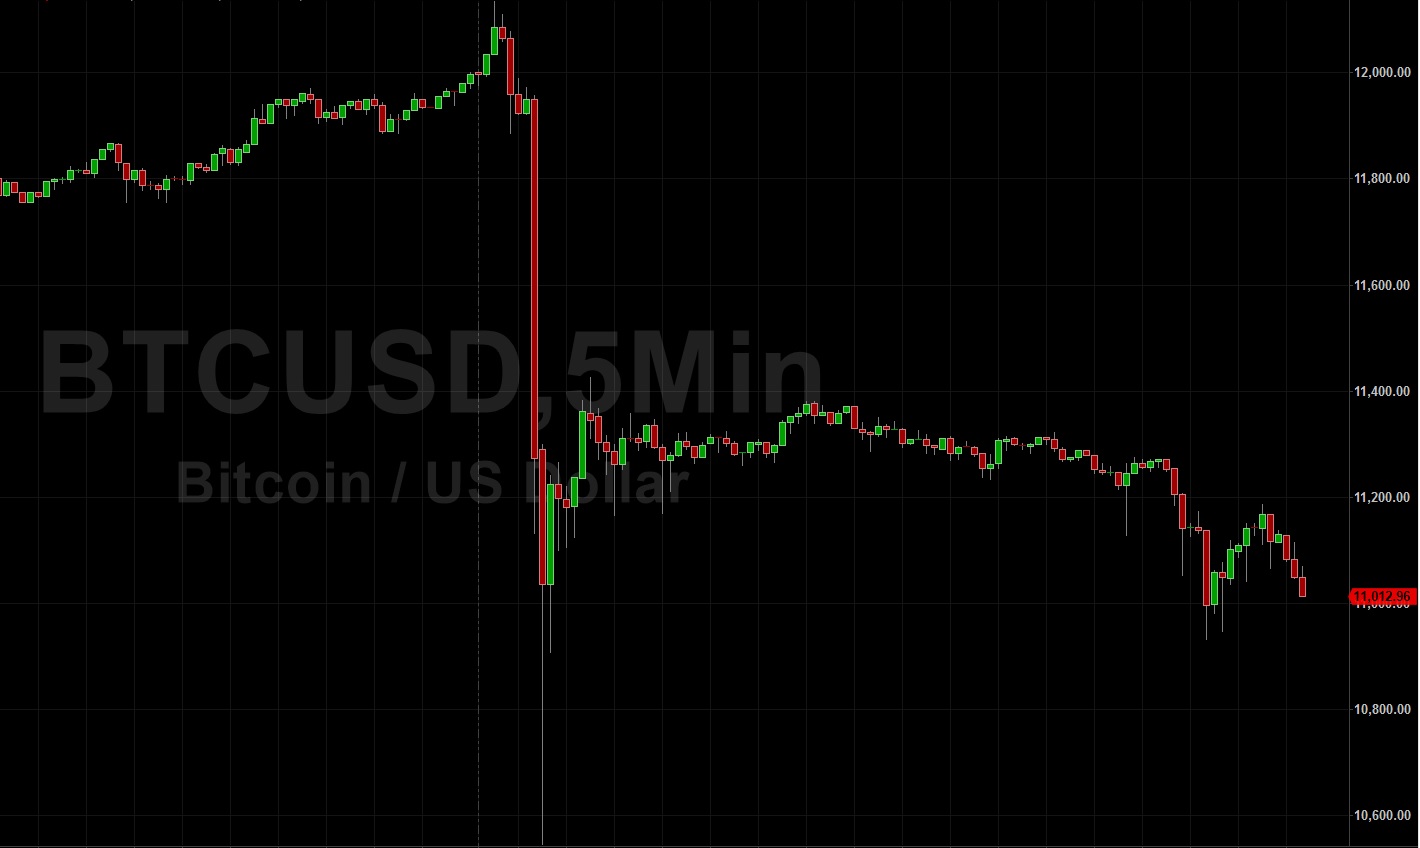
Bitcoin (BTC/USD) remained remained volatile the psychologically-important 11000 figure early in today’s Asian session as traders continued to lick their wounds following the recent sharp move higher to the 12134.29 area and subsequent drastic fall to the 10546.15 area before its recovery back above the 11000 figure. Stop hunters elected Stops below the 11385.78, 11372.38, 11350.94, 10938.90, 10901.02, 10866.33, and 10569.65 areas during the rapid depreciation. If downside pressure persists, traders will pay close attention to liquidity and Stops around the 10474.65, 10200.39, 10139.11, and 10082.97 levels. Recently, Stops were elected above the 11761.97 and 11570.81 areas, and traders continue to focus on the 12268.47 and 12311.39 areas as upside price objectives. During the recent appreciations to a series of fresh 2020 peaks, Stops were elected above the 11026.97, 11115.62, 11340.92, 11399.17, and 11407.81 areas. Last week, bids emerged around the 10811.00 on a pullback lower, just above the 10805.22 area that represents the 23.6% retracement of the recent appreciating range from 8815.01 to 11420.00. Recently, traders have lifted the pair above some historical levels of technical significance including the 9532.39, 9772.95, 9948.12, 10260.38, 10276.29, 10354.90, 10615.49, 10647.72, and 10816.43 levels. Following BTC/USD’s move higher above the 11420.00 area, updated levels of technical support include the 10850.06, 10826.66, 10459.59, 10212.50, and 10162.92 levels. Traders are closely monitoring recent depreciating ranges including the move from 9792.00 to 8815.01, the move from 10018.67 to 8815.01, and the depreciation from 10428.00 to 8815.01. Important technical levels related to these depreciating ranges include the 9418.79, 9561.43, 9558.87, 9582.92, 9621.51, 9734.61, 9761.09, 9811.84, 10047.33, and 10082.82 areas.
A recent appreciating range that traders are monitoring is the move from 8632.93 to 11420.00, with the 10762.25 and 10355.34 areas representing the 23.6% and 38.2% retracements of this appreciation. Below current price activity, Stops have been absorbed below the 8877.48 area, a level that represents the 23.6% retracement of the recent appreciation from 3858 to 10428. Additional downside areas of potential technical support include the 8993.44, 8695.01, 8680.35, 8654.53, and 8603.46 levels. Traders are also paying attention to multiple trading ranges including the recent application from 8106.70 to 9957.25, the appreciation from 6456.00 to 10079.00, the appreciation from 5678.20 to 10079.00, the broader appreciation from 3858.00 to 10079.00, and the appreciation from 8632.93 to 10428.00. Important technical levels related to these ranges include 9530.47, 9318.65, 9040.41, 9025.32, 8808.52, 8695.01, 8610.84, 8540.29, 8398.89, 8267.50, and others. Chartists are observing that the 50-bar MA (4-hourly) is bullishly indicating above the 200-bar MA (4-hourly) and above the 100-bar MA (4-hourly). Also, the 50-bar MA (hourly) is bullishly indicating above the 200-bar MA (hourly) and above the 100-bar MA (hourly).
Price activity is nearest the 50-bar MA (4-hourly) at 10844.04 and the 100-bar MA (Hourly) at 11288.68.
Technical Support is expected around 10481.33/ 10268.38/ 9879.78 with Stops expected below.
Technical Resistance is expected around 12268.47/ 12311.39/ 13488.49 with Stops expected above.
On 4-Hourly chart, SlowK is Bearishly below SlowD while MACD is Bearishly below MACDAverage.
On 60-minute chart, SlowK is Bearishly below SlowD while MACD is Bearishly below MACDAverage.