Bitcoin (BTC/USD) continued to eye advances above the 11000 figure early in today’s Asian session as traders are seeking to build upon the upward price pressure that emerged around the 10911.74 area during yesterday’s Asian session, just above the 38.2% retracement of the recent appreciating range from 8905.84 to 12134.29. After the recent appreciation to the 12134.29 area, profit-taking pushed the pair lower to the 10546.15 area, just above the 50% retracement of the same appreciating range. Additional upside price objectives include the 12227.83, 12268.47, 12311.39, 12859.49, and 13107.05 levels, targets related to areas of buying pressure that emerged earlier this year around the 3858.00 area and above. Stops were recently elected above the 11026.97, 11115.62, 11340.92, 11399.17, 11407.81, 11570.81, and 11761.97 levels.
Following the pair’s recent appreciation to the 12134.29 level, traders are observing retracement levels around the 11395.78, 11350.94, 11307.97, 10938.90, 10866.33, 10796.77, 10651.81, 10569.65, 10474.65, 10383.61, and 10316.39 areas. Below those areas, some potential areas of technical support include the 10200.39, 10139.11, and 10082.97 areas. Chartists are observing that the 50-bar MA (4-hourly) is bullishly indicating above the 200-bar MA (4-hourly) and above the 100-bar MA (4-hourly). Also, the 50-bar MA (hourly) is bullishly indicating above the 200-bar MA (hourly) and above the 100-bar MA (hourly).
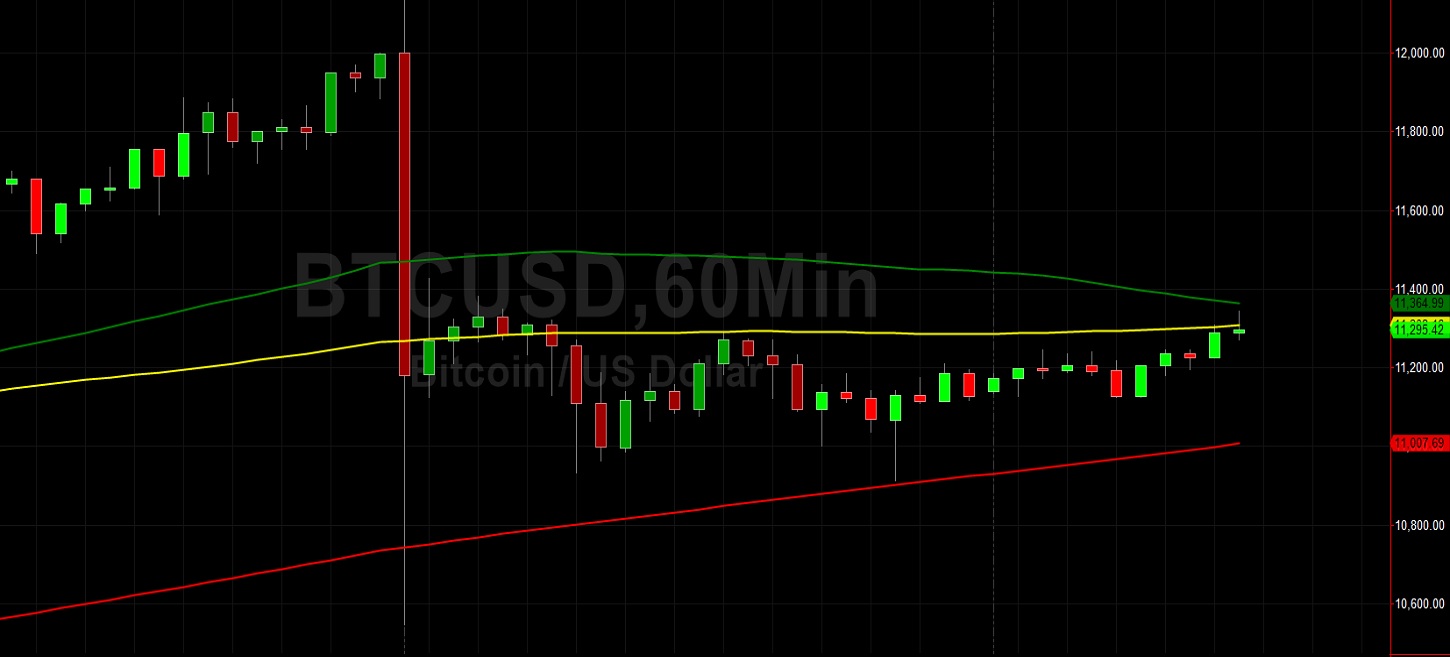
Price activity is nearest the 50-bar MA (4-hourly) at 11027.74 and the 100-bar MA (Hourly) at 11308.17.
Technical Support is expected around 10481.33/ 10268.38/ 9879.78 with Stops expected below.
Technical Resistance is expected around 12268.47/ 12311.39/ 13488.49 with Stops expected above.
On 4-Hourly chart, SlowK is Bullishly above SlowD while MACD is Bearishly below MACDAverage.
On 60-minute chart, SlowK is Bearishly below SlowD while MACD is Bullishly above MACDAverage.