Bitcoin (BTC/USD) was a bit on the defensive early in today’s Asian session as bears again seemed to be in control following selling pressure that emerged around the 11818.18 area during yesterday’s North American session. Traders pushed the pair lower to the 11608.78 area during yesterday’s North American session, testing the 100-hour simple moving average. Bids emerged right around the 200-hour simple moving average late last week. Traders are immediately focused on the 11395.78, 11372.38, 11350.94, and 11307.97 areas, representing the 23.6% retracements of the recent appreciating ranges that commenced around the 9005.00, 8905.84, 8815.01, and 8632.93 areas. A key level where buying pressure recently emerged is around the the 11529.38 level, a test of the 11510.44 area that represents the 50% retracement of a historical depreciation from 19891.99 to 3128.89. Another technical level that created some upward momentum recently is the 11697.77 area, representing the 23.6% retracement of the recent appreciation from 4670.69 to 13868.44. Traders recently drove BTC/USD as high as the 12134.29 area before profit-taking pushed the pair lower to the 10546.15 area, just above the 50% retracement of the same appreciating range from 8905.84 to 12134.29.
Additional upside price objectives include the 12227.83, 12268.47, 12311.39, 12859.49, and 13107.05 levels, targets related to areas of buying pressure that emerged earlier this year around the 3858.00 area and above. Stops were recently elected above the 11026.97, 11115.62, 11340.92, 11399.17, 11407.81, 11570.81, and 11761.97 levels. Following the pair’s recent appreciation to the 12134.29 level, traders are observing retracement levels around the 11395.78, 11350.94, 11307.97, 10938.90, 10866.33, 10796.77, 10651.81, 10569.65, 10474.65, 10383.61, and 10316.39 areas. Below those areas, some potential areas of technical support include the 10200.39, 10139.11, and 10082.97 areas. Chartists are observing that the 50-bar MA (4-hourly) is bullishly indicating above the 200-bar MA (4-hourly) and above the 100-bar MA (4-hourly). Also, the 50-bar MA (hourly) is bullishly indicating above the 200-bar MA (hourly) and above the 100-bar MA (hourly).
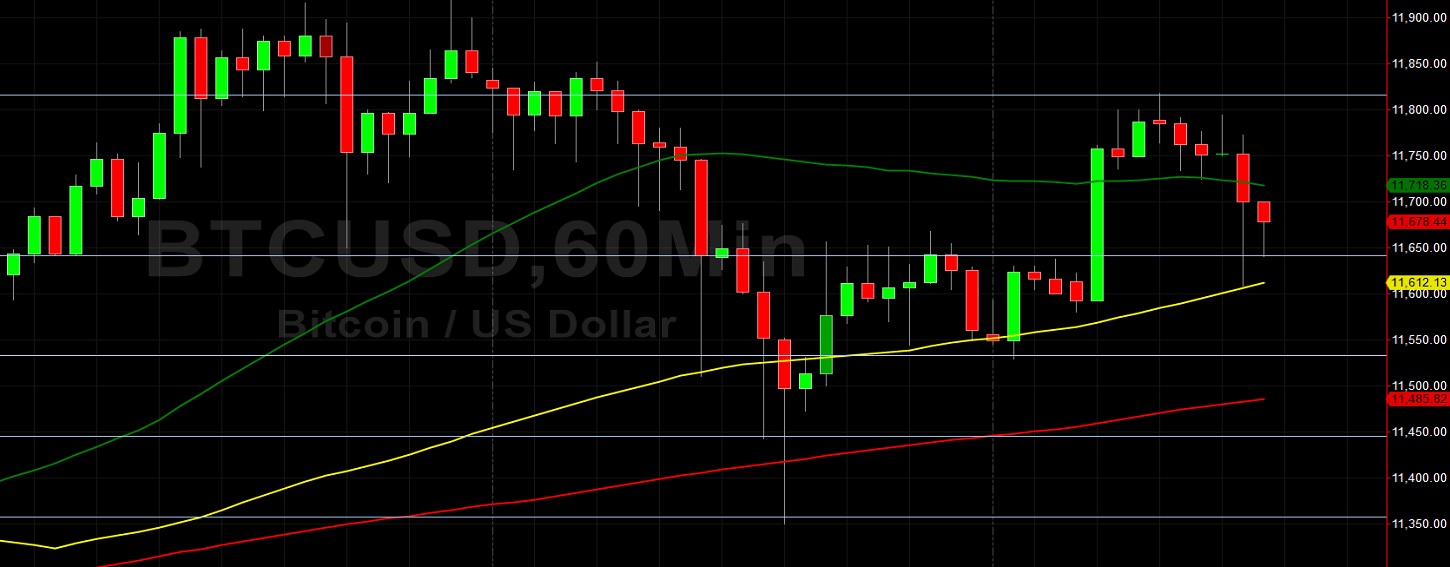
Price activity is nearest the 50-bar MA (4-hourly) at 11497.70 and the 50-bar MA (Hourly) at 11718.19.
Technical Support is expected around 11357.46/ 11249.01/ 11073.70 with Stops expected below.
Technical Resistance is expected around 12268.47/ 12311.39/ 13488.49 with Stops expected above.
On 4-Hourly chart, SlowK is Bullishly above SlowD while MACD is Bearishly below MACDAverage.
On 60-minute chart, SlowK is Bearishly below SlowD while MACD is Bullishly above MACDAverage.