Bitcoin (BTC/USD) remained pressured early in today’s Asian session as the pair continued to orbit the 11500 area following its recent depreciation from the 11892.16 area. Traders drove BTC/USD as low as the 11370 area late last week after Stops were elected below the 11642.05, 11603.11, 11560.28, 11533.61, 11516.38, and 11442.52 areas, levels related to the pair’s recent appreciation to the 12486.61 area. The print at 11370 also represented a test of the 11348.03 area, a level related to selling pressure that recently emerged around the 12086.22 area. The pair recently traded as high as the 12486.61 area, its strongest print since July 2019. After the depreciation of BTC/USD recently from 12486.61 to 11825.00, traders were unable to gain a foothold above the 12077.74 area during a retracement higher, representing the 38.2% retracement of the depreciating range. Traders are paying close attention to some levels where Stops were recently triggered during the move higher, including the 11992.15, 12086.22, 12112.97, 12173.80, and 12348.26 areas. Traders note that the recent high of 12486.61 represented a test of the 12496.68 area, an upside price objective related to buying pressure that emerged around the 8055.91 area earlier this year.
Additional retracement levels in this appreciating range include the 11316.19, 11134.46, and 10909.61 areas. Traders also remain focused on the 12023.45, 11964.56, 11880.38, 11803.31, 11737.30, 11642.95, 11560.28, and 11533.51 areas during pullbacks lower, representing the retracements of the recent appreciating ranges that commenced around the 9005.00, 8905.84, 8815.01, and 8632.93 areas. A key level where buying pressure recently emerged is around the the 11529.38 level, a test of the 11510.44 area that represents the 50% retracement of a historical depreciation from 19891.99 to 3128.89. Additional upside price objectives include the 12713.18, 12859.49, and 13107.05 levels, targets related to areas of buying pressure that emerged earlier this year around the 3858.00 area and above. Stops were recently elected above the 11026.97, 11115.62, 11340.92, 11399.17, 11407.81, 11570.81, and 11761.97 levels. Below those areas, some potential areas of technical support include the 10200.39, 10139.11, and 10082.97 areas. Chartists are observing that the 50-bar MA (4-hourly) is bullishly indicating above the 200-bar MA (4-hourly) and above the 100-bar MA (4-hourly). Also, the 50-bar MA (hourly) is bearishly indicating below the 100-bar MA (hourly) and below the 200-bar MA (hourly).
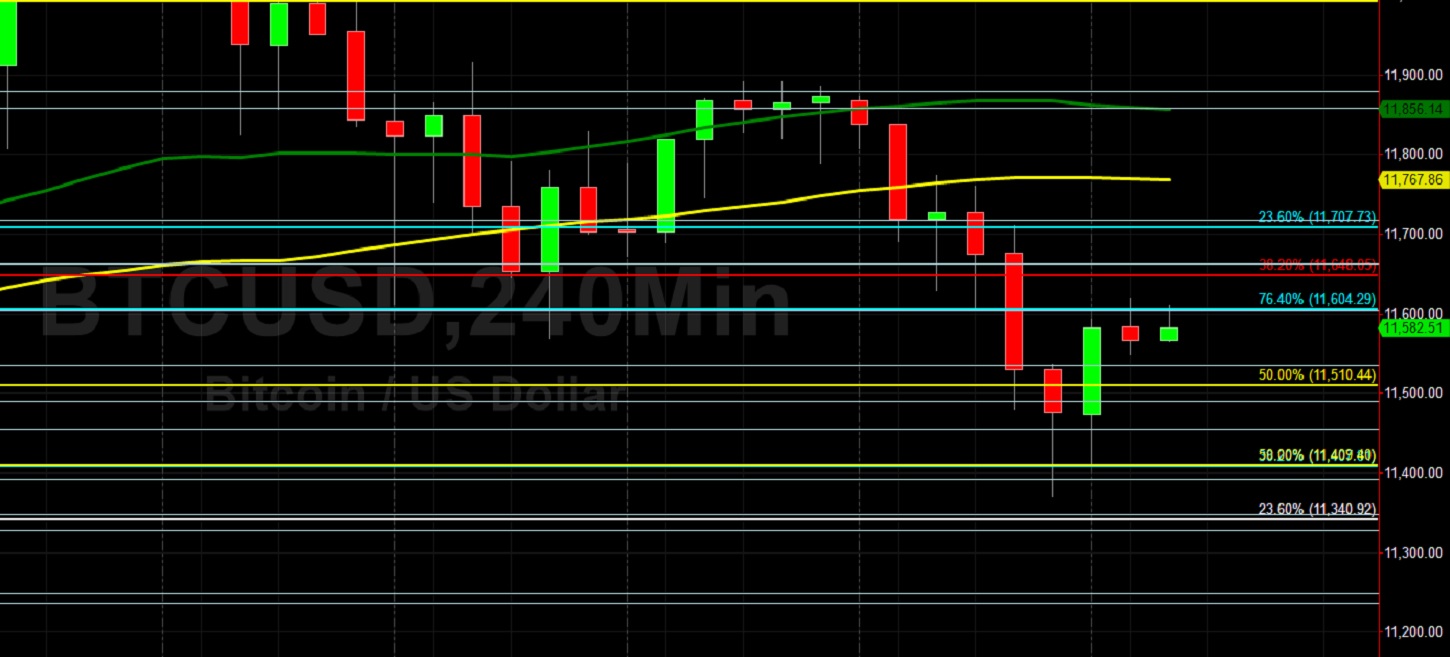
Price activity is nearest the 100-bar MA (4-hourly) at 11767.90 and the 50-bar MA (Hourly) at 11702.60.
Technical Support is expected around 11348.03/ 11120.00/ 11004.10 with Stops expected below.
Technical Resistance is expected around 12496.68/ 12713.18/ 13202.63 with Stops expected above.
On 4-Hourly chart, SlowK is Bullishly above SlowD while MACD is Bearishly below MACDAverage.
On 60-minute chart, SlowK is Bullishly above SlowD while MACD is Bullishly above MACDAverage.