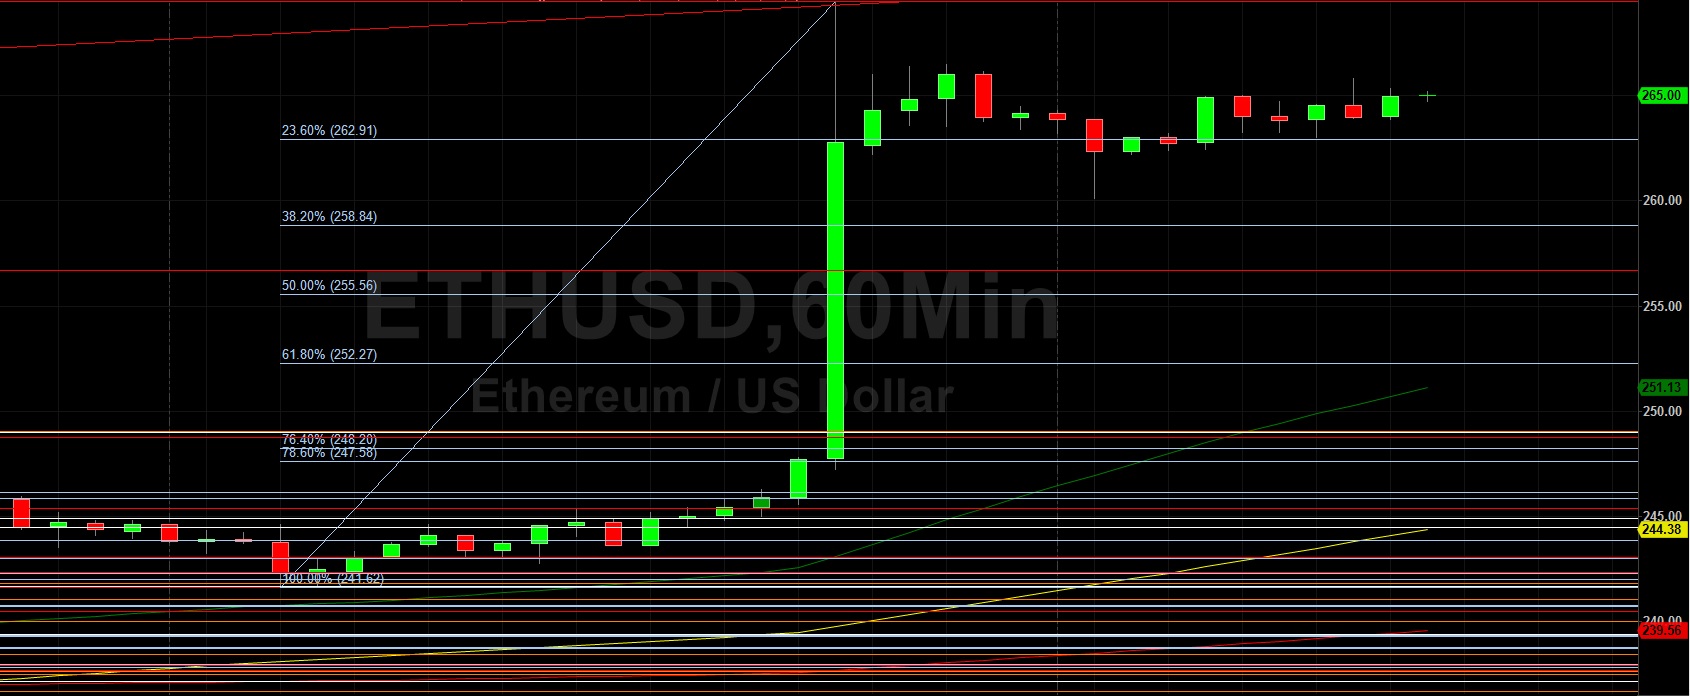
Ethereum (ETH/USD) attempted to sustain yesterday’s strong move higher early in today’s North American session as the pair traded as high as the 265.81 level after trading as low as the 260.10 level during the Asian session. During yesterday’s North American session, ETH/USD found a bid from the 243.59 area and acute buying pressure propelled the pair as high as the 269.49 area before some profit-taking ensued. Notably, the pair encountered technical resistance around the 269.66 area, representing the 61.8% retracement of the depreciation from 364.49 to 116.25. Upside price objectives including 260.23 and 262.90 were easily absorbed during the pair’s move higher. Following the pair’s most recent range expansion, traders are paying close attention to price activity during retracements lower around the 262.91, 258.84, 255.56, 252.27, and 248.20 levels. Additional technically significant levels include the 247.20 and 242.80 areas, representing the 78.6% and 76.4% retracements of this year’s depreciation from 290.00 to 90.00. The 253.60 area remains another important technical level and traders are very interested to see how markets react around this level.
If the market fails to sustain its recent move above the 260 area, traders are waiting to see what will happen around areas of technical significance including the 256.67, 248.74, 242.33, 235.91, and 226.79 levels. Traders are also eyeing the 221.29, 215.16, 190.93, 186.00, 185.39, and 185.11 levels as area of possible technical support. Notably, the 214.99 area represents the 23.6% retracement of the appreciation from 90.00 to 253.60. Appreciating ranges that are technically significant include the move from 148.08 to 227.50, the move from 123.72 to 227.50, the move from 176.43 to 216.99, the appreciation from 90.00 to 253.60, and the appreciation from 196.65 to 253.60. Important technical levels related to those ranges include the 240.16, 231.85, 225.13, 208.76, 203.01, 197.16, 195.10, 187.79, and 175.02 levels, and traders are very interested to observe how price activity reacts around these levels. Chartists are observing that the 50-bar MA (4-hourly) is bearishly indicating below the 100-bar MA (4-hourly) and above the 200-bar MA (4-hourly). Also, the 50-bar MA (hourly) is bullishly indicating above the 100-bar MA (hourly) and above the 200-bar MA (hourly).
Price activity is nearest the 100-bar MA (4-hourly) at 240.33 and the 50-bar MA (Hourly) at 251.13.
Technical Support is expected around 248.74/ 242.33/ 235.91 with Stops expected below.
Technical Resistance is expected around 273.06/ 278.15/ 290.00 with Stops expected above.
On 4-Hourly chart, SlowK is Bearishly below SlowD while MACD is Bullishly above MACDAverage.
On 60-minute chart, SlowK is Bearishly below SlowD while MACD is Bearishly below MACDAverage.