Bitcoin (BTC/USD) slightly extended its downward pressure early in today’s North American session as the pair recently weakened to the 9039.84 area after running out of steam around the 9103.11 area during yesterday’s Asian session. Traders have kept the pair confined to a relatively tight range after it weakened from the 9297.20 area last week. Minor Stops were recently elected below the 9048.50 area, representing the 50% retracement of the recent appreciation from 8938.00 to 9159.00. Traders continue to observe the 9045.58 area as an important technical level that represents the 23.6% retracement of the recent depreciation from 9792.00 to 8815.01. One short-term range that traders are observing is the recent decline from 9297.20 to 8938.00, with some recent technical resistance seen just above the 9117.60 area that represents its 50% retracement. Above that level, traders will pay close attention to 9159.99 and 9212.43 levels as upside retracement areas. Traders are observing the recent depreciating range from 10428.00 to 8815.01, with the 9195.68 area representing the 23.6% retracement of this range and an important area that BTC/USD bulls will need to build upon if they are to make advancements higher. The next upside retracement levels in this depreciating range include the 9431.17 and 9621.51 areas, and technicians will carefully monitor these levels. Below current price activity, the 8993.44 area is a retracement level that represents the 61.8% retracement of the appreciation from 8106.70 to 10428.00, and the next downside price retracement levels in this appreciating range include the 8654.53 and 8603.46 levels. Larger Stops have recently been absorbed below the 8877.48 area, a level that represents the 23.6% retracement of the recent appreciation from 3858 to 10428.
Relatively large Stops have also recently been triggered below the 9056.57 and 9017.07 areas, representing the 76.4% and 78.6% retracements of the broader appreciation from 8632.93 to 10428.00. Another important level is the 8910.70 area, and Stops were recently elected below this level, an upside price objective related to buying pressure that emerged around the 6456 area in April. Traders are carefully observing the 8763.44 and 8695.01 levels during additional moves lower. Traders are also paying attention to multiple trading ranges including the recent appreciation from 8106.70 to 9957.25, the appreciation from 6456.00 to 10079.00, the appreciation from 5678.20 to 10079.00, the broader appreciation from 3858.00 to 10079.00, and the appreciation from 8632.93 to 10428.00. Important technical levels related to these ranges include 9530.47, 9318.65, 9040.41, 9025.32, 8808.52, 8695.01, 8610.84, 8540.29, 8398.89, 8267.50, 7878.60, 7839.99, 7702.58, 7359.31, and others. Chartists are observing that the 50-bar MA (4-hourly) is bearishly indicating below the 100-bar MA (4-hourly) and below the 200-bar MA (4-hourly). Also, the 50-bar MA (hourly) is bearishly indicating below the 100-bar MA (hourly) and below the 200-bar MA (hourly).
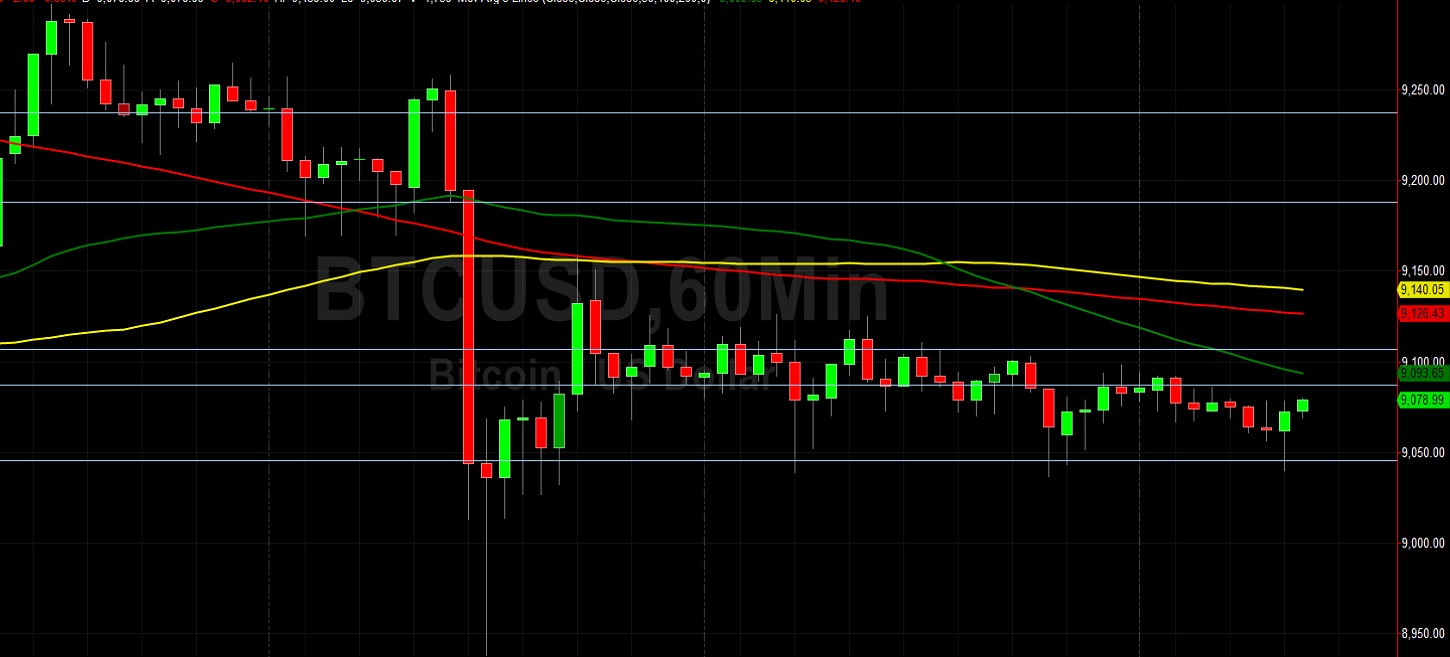
Price activity is nearest the 50-bar MA (4-hourly) at 9120.61 and the 50-bar MA (Hourly) at 9093.67.
Technical Support is expected around 8695.01/ 8540.29/ 8267.50 with Stops expected below.
Technical Resistance is expected around 9561.43/ 10066.21/ 10428.00 with Stops expected above.
On 4-Hourly chart, SlowK is Bullishly above SlowD while MACD is Bearishly below MACDAverage.
On 60-minute chart, SlowK is Bullishly above SlowD while MACD is Bullishly above MACDAverage.