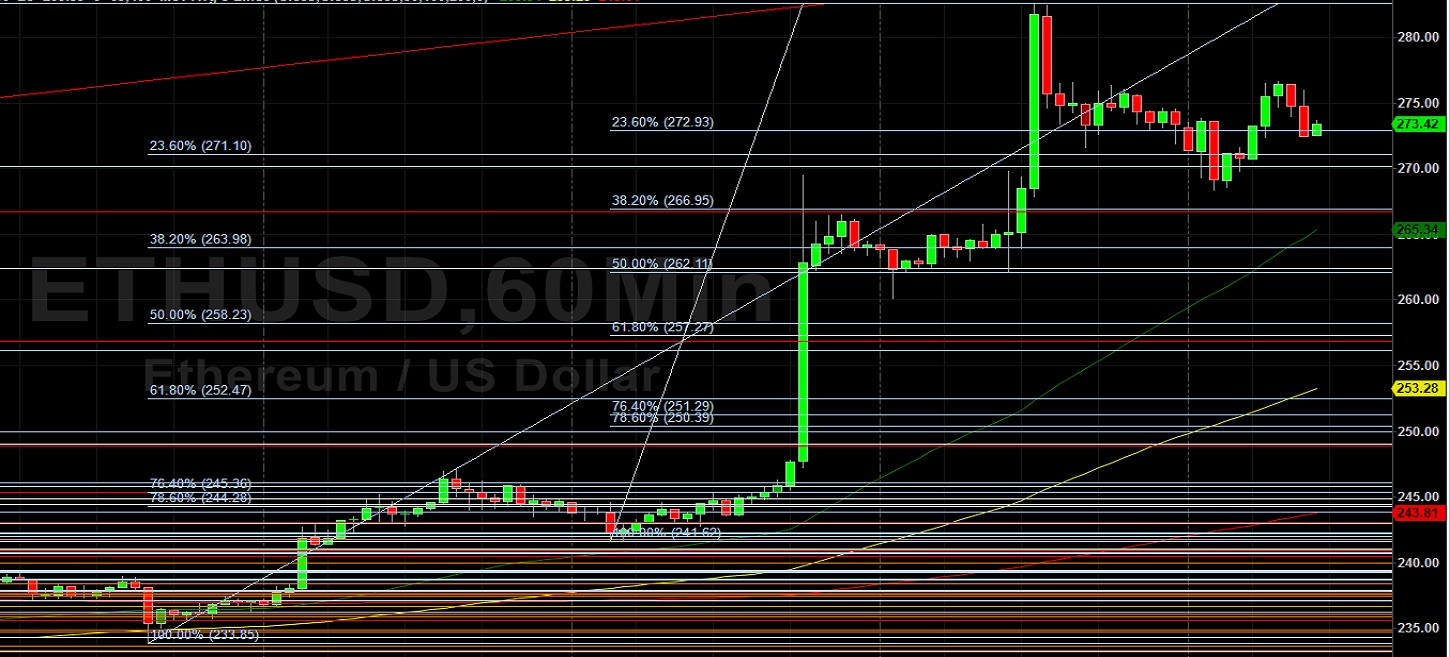
Ethereum (ETH/USD) traded sideways early in today’s North American session as the pair traded as high as the 276.60 level after trading as low as the 268.38 level during the European session. During yesterday’s North American session, traders extended recent gains and pushed ETH/USD to a recent multi-week high of 282.60, within strinking distance of the pair’s 2020 high print of 290.00. ETH/USD pulled back during the Asian session and some Stops were reached below the 270.13 level, representing the 23.6% retracement of the appreciating range from 229.77 to 282.60. Some technical support later emerged at the 273.00 area, just above the 23.6% retracement of the narrower appreciating range from 241.62 to 282.60. Following the pair’s most recent range expansion, traders are paying close attention to price activity during retracements lower around the 270.13, 262.42, 256.19, 249.95, and 242.24 levels. Additional technically significant levels include the 247.20 and 242.80 areas, representing the 78.6% and 76.4% retracements of this year’s depreciation from 290.00 to 90.00.
If the market fails to sustain its recent move above the 280 area, traders are waiting to see what will happen around areas of technical significance including the 256.67, 248.74, 242.33, 235.91, and 226.79 levels. Traders are also eyeing the 221.29, 215.16, 190.93, 186.00, 185.39, and 185.11 levels as areas of possible technical support during retracements lower. Notably, the 214.99 area represents the 23.6% retracement of the appreciation from 90.00 to 253.60. Appreciating ranges that are technically significant include the move from 148.08 to 227.50, the move from 123.72 to 227.50, the move from 176.43 to 216.99, the appreciation from 90.00 to 253.60, and the appreciation from 196.65 to 253.60. Important technical levels related to those ranges include the 240.16, 231.85, 225.13, 208.76, 203.01, 197.16, 195.10, 187.79, and 175.02 levels, and traders are very interested to observe how price activity reacts around these levels. Chartists are observing that the 50-bar MA (4-hourly) is bullishly indicating above the 100-bar MA (4-hourly) and above the 200-bar MA (4-hourly). Also, the 50-bar MA (hourly) is bearishly indicating below the 100-bar MA (hourly) and below the 200-bar MA (hourly).
Price activity is nearest the 50-bar MA (4-hourly) at 244.38 and the 50-bar MA (Hourly) at 265.34.
Technical Support is expected around 248.74/ 242.33/ 235.91 with Stops expected below.
Technical Resistance is expected around 289.64/ 314.17/ 354.22 with Stops expected above.
On 4-Hourly chart, SlowK is Bearishly below SlowD while MACD is Bullishly above MACDAverage.
On 60-minute chart, SlowK is Bearishly below SlowD while MACD is Bearishly below MACDAverage.