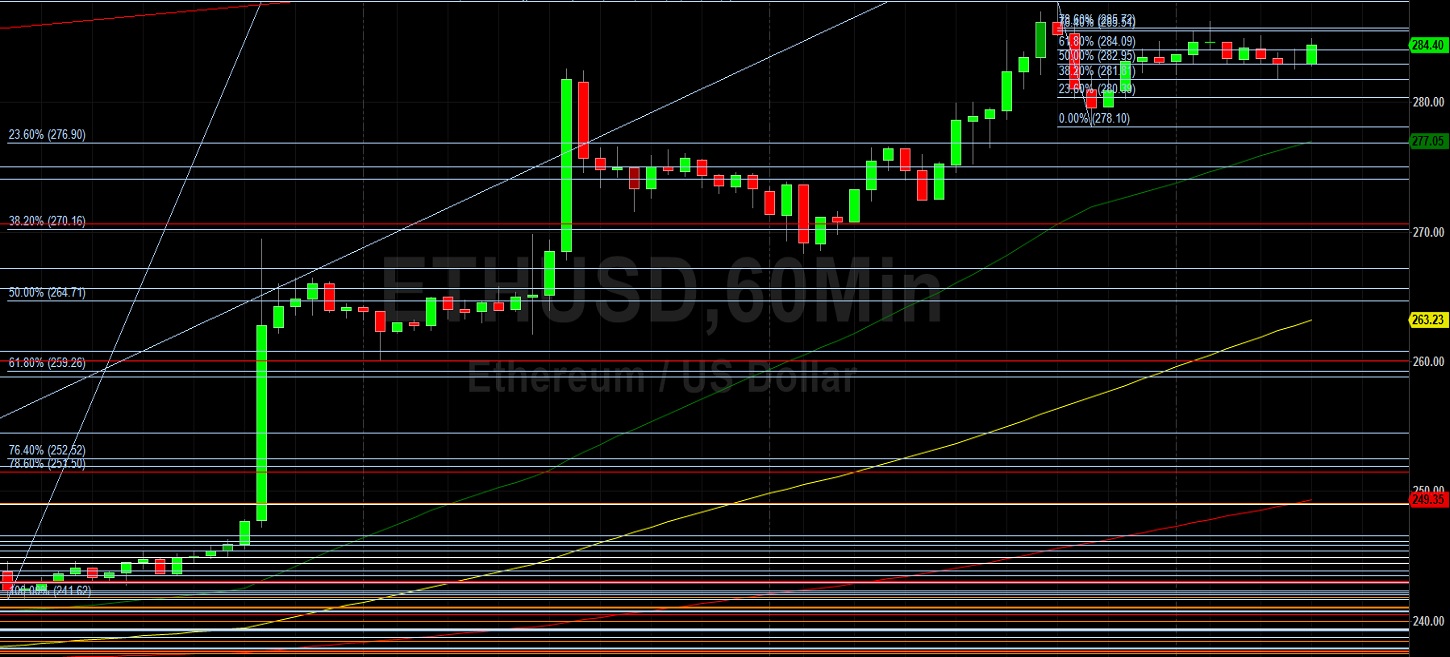
Ethereum (ETH/USD) extended recent gains early in today’s North American session as the pair traded as high as the 284.12 level after encountering selling pressure around the 287.80 level during the Asian session, stopping just short of establishing a new 2020 high above the 290.00 area. Significant Stops have recently been elected above the 278.02 area, an upside price objective related to buying pressure that emerged around the 90.00 area in March. Similar upside price objectives related to buying pressure from the 90.00 area include the 290.07, 301.02, 312.82, 316.32, 336.10, and 337.33 areas. In the short-term, traders are observing the recent depreciating range from 287.80 to 278.10, and have seen some bids emerge around the 281.81 area, representing the 38.2% retracement. Following the pair’s most recent range expansion, traders are paying close attention to price activity during retracements lower around the 275.07, 267.19, 260.83, 254.46, and 246.58 levels. Additional technically significant levels include the 270.16, 264.71, and 259.26 areas, with stronger bids likely around the 274.10, 265.63, 258.79, and 251.94 areas.
If the market fails to sustain its recent move above the 280 area, traders are waiting to see what will happen around areas of technical significance including the 256.67, 248.74, 242.33, 235.91, and 226.79 levels. Traders are also eyeing the 221.29, 215.16, 190.93, 186.00, 185.39, and 185.11 levels as areas of possible technical support during retracements lower. Notably, the 214.99 area represents the 23.6% retracement of the appreciation from 90.00 to 253.60. Appreciating ranges that are technically significant include the move from 148.08 to 227.50, the move from 123.72 to 227.50, the move from 176.43 to 216.99, the appreciation from 90.00 to 253.60, and the appreciation from 196.65 to 253.60. Important technical levels related to those ranges include the 240.16, 231.85, 225.13, 208.76, 203.01, 197.16, 195.10, 187.79, and 175.02 levels, and traders are very interested to observe how price activity reacts around these levels. Chartists are observing that the 50-bar MA (4-hourly) is bullishly indicating above the 100-bar MA (4-hourly) and above the 200-bar MA (4-hourly). Also, the 50-bar MA (hourly) is bullishly indicating above the 100-bar MA (hourly) and above the 200-bar MA (hourly).
Price activity is nearest the 50-bar MA (4-hourly) at 250.51 and the 50-bar MA (Hourly) at 277.04.
Technical Support is expected around 248.74/ 242.33/ 235.91 with Stops expected below.
Technical Resistance is expected around 301.02/ 314.17/ 354.22 with Stops expected above.
On 4-Hourly chart, SlowK is Bearishly below SlowD while MACD is Bullishly above MACDAverage.
On 60-minute chart, SlowK is Bullishly above SlowD while MACD is Bearishly below MACDAverage.