Ethereum (ETH/USD) found a slight bid early in today’s North American session as the pair traded as high as the 240.04 level after trading as low as the 238.11 area during today’s European session. Traders took the pair as high as the 242.01 area early in today’s Asian session, just above the 241.79 level that represents the 78.6% retracement of the recent depreciation from 249.04 to 215.16. The pair’s inability to gain traction above this level suggests some short-term weakness is likely for ETH/USD. One short-term appreciating range that traders are observing is the recent move from 233.50 to 249.00, with recent trading activity orbiting the 239.26 level, representing the 38.2% retracement. Traders continue to observe that the pair has recently tested and managed to remain above the 236.25 level, an area that represents the 50% retracement of the this appreciating range. Notably, the 249.00 area was also strong resistance for the pair in late June when ETH/USD recovered from its monthly low of 215.16. The 253.60 area remains another important upside target if traders are able to move above this technical resistance. Additional technically significant levels include the 247.20 and 242.80 areas, representing the 78.6% and 76.4% retracements of this year’s depreciation from 290.00 to 90.00. Further above recent price activity, upside price objectives include the 260.23 and 262.90 areas. Following the pair’s recent movements, potential areas of technical support include the 236.25, 233.24, 229.52, and 228.96 levels.
Below current price activity, traders are waiting to see what will happen around the 222.95 area, representing the 23.6% retracement of the recent appreciation from 123.72 to 253.60. Traders are also eyeing the 221.29, 215.16, 190.93, 186.00, 185.39, and 185.11 levels as area of possible technical support. Notably, the 214.99 area represents the 23.6% retracement of the appreciation from 90.00 to 253.60. Appreciating ranges that are technically significant include the move from 148.08 to 227.50, the move from 123.72 to 227.50, the move from 176.43 to 216.99, the appreciation from 90.00 to 253.60, and the appreciation from 196.65 to 253.60. Important technical levels related to those ranges include the 240.16, 231.85, 225.13, 208.76, 203.01, 197.16, 195.10, 187.79, and 175.02 levels, and traders are very interested to observe how price activity reacts around these levels. Chartists are observing that the 50-bar MA (4-hourly) is bullishly indicating above the 200-bar MA (4-hourly) and above the 100-bar MA (4-hourly). Also, the 50-bar MA (hourly) is bearishly indicating below the 100-bar MA (hourly) and below the 200-bar MA (hourly).
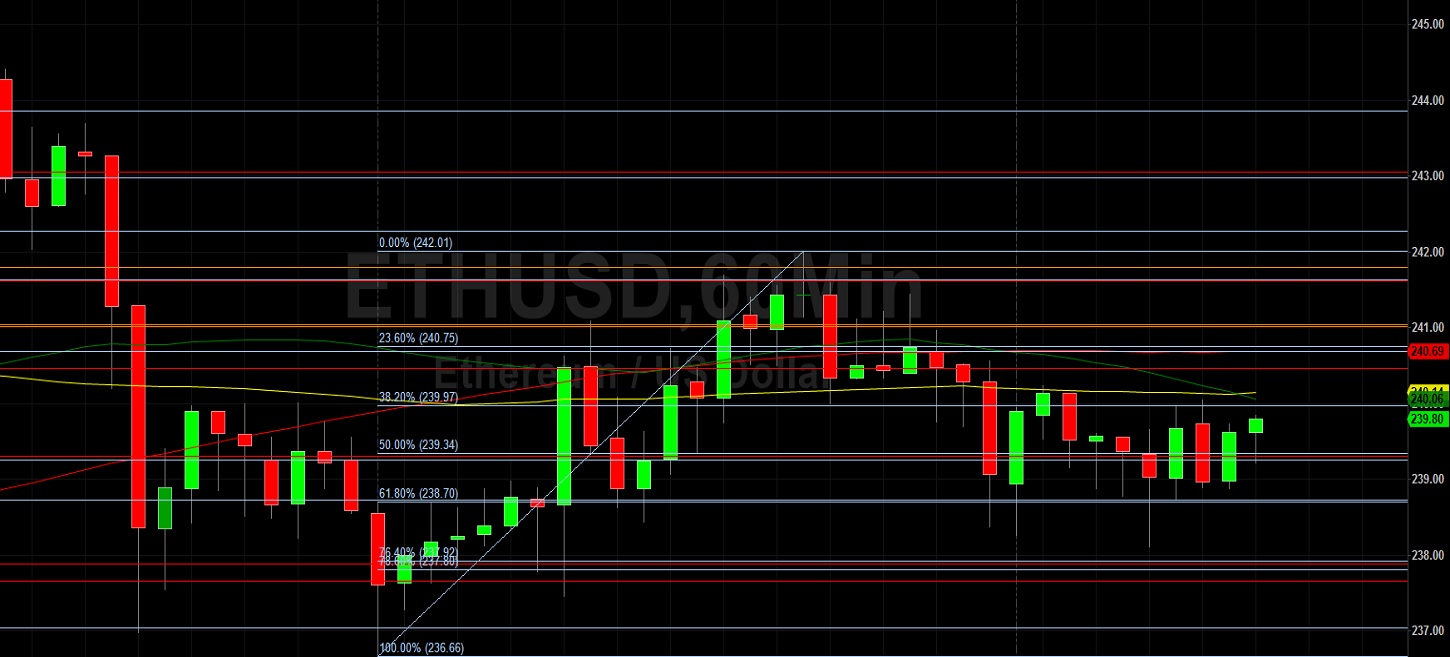
Price activity is nearest the 50-bar MA (4-hourly) at 240.83 and the 50-bar MA (Hourly) at 240.06.
Technical Support is expected around 223.50/ 215.16/ 191.27 with Stops expected below.
Technical Resistance is expected around 249.04/ 253.60/ 265.01 with Stops expected above.
On 4-Hourly chart, SlowK is Bearishly below SlowD while MACD is Bearishly below MACDAverage.
On 60-minute chart, SlowK is Bullishly above SlowD while MACD is Bearishly below MACDAverage.