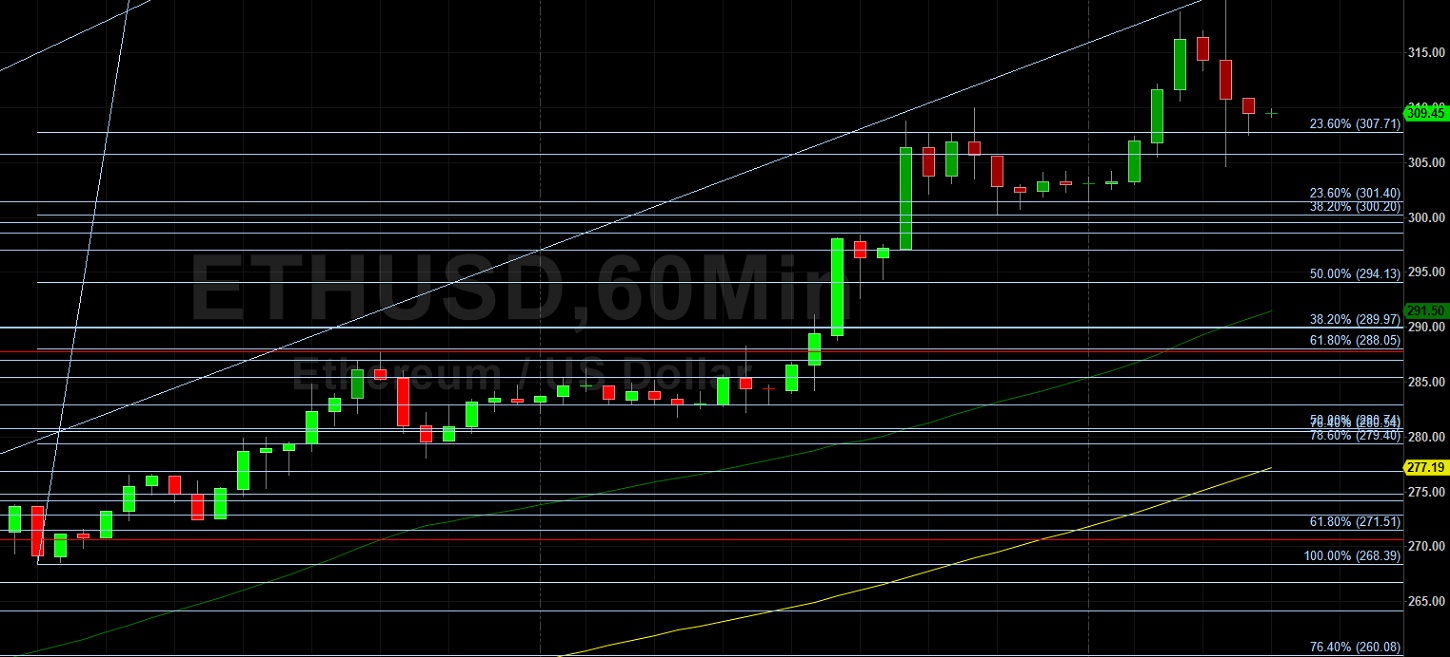
Ethereum (ETH/USD) extended its fresh 2020 high early in today’s North American session as the pair traded as high as the 319.86 after moving above the psychologically-important 300.00 figure for the first time since July 2019. Significant Stops were elected above the 290.00 area, the previous 2020 high prior to the strong ascent that emerged late in yesterday’s North American session. Additional Stops were triggered above the 301.02, 312.82, and 316.32 areas, levels that are related to buying pressure that emerged around the 90.00 area after the pair’s precipitous decline this year. Additonal upside price objectives include the 322.16, 328.56, 336.10, 337.33, and 342.29 areas. A couple of interesting levels that traders will observe on retracements lower include the 301.20 and 301.40 areas, and they are related to buying pressure that emerged around the 241.62 and 319.86 areas. After crossing the psychologically-important 300.00 figure, technical support is now evident around the 299.56, 287.00, 276.86, and 266.71 levels.
If the market fails to sustain its recent move above the 300 area, traders are waiting to see what will happen around areas of technical significance including the 281.81, 275.07, 267.19, 260.83, 254.46, and 246.58 levels. Stronger bids are likely in place around the 298.60, 285.45, 274.82, and 264.18 areas. Appreciating ranges that are technically significant include the move from 148.08 to 227.50, the move from 123.72 to 227.50, the move from 176.43 to 216.99, the appreciation from 90.00 to 253.60, and the appreciation from 196.65 to 253.60. Important technical levels related to those ranges include the 240.16, 231.85, 225.13, 208.76, and 203.01 levels, and traders are very interested to observe how price activity reacts around these levels. Chartists are observing that the 50-bar MA (4-hourly) is bullishly indicating above the 100-bar MA (4-hourly) and above the 200-bar MA (4-hourly). Also, the 50-bar MA (hourly) is bullishly indicating above the 100-bar MA (hourly) and above the 200-bar MA (hourly).
Price activity is nearest the 50-bar MA (4-hourly) at 259.33 and the 50-bar MA (Hourly) at 291.51.
Technical Support is expected around 281.81/ 275.07/ 267.19 with Stops expected below.
Technical Resistance is expected around 322.16/ 328.567/ 336.10 with Stops expected above.
On 4-Hourly chart, SlowK is Bearishly below SlowD while MACD is Bullishly above MACDAverage.
On 60-minute chart, SlowK is Bearishly below SlowD while MACD is Bearishly below MACDAverage.