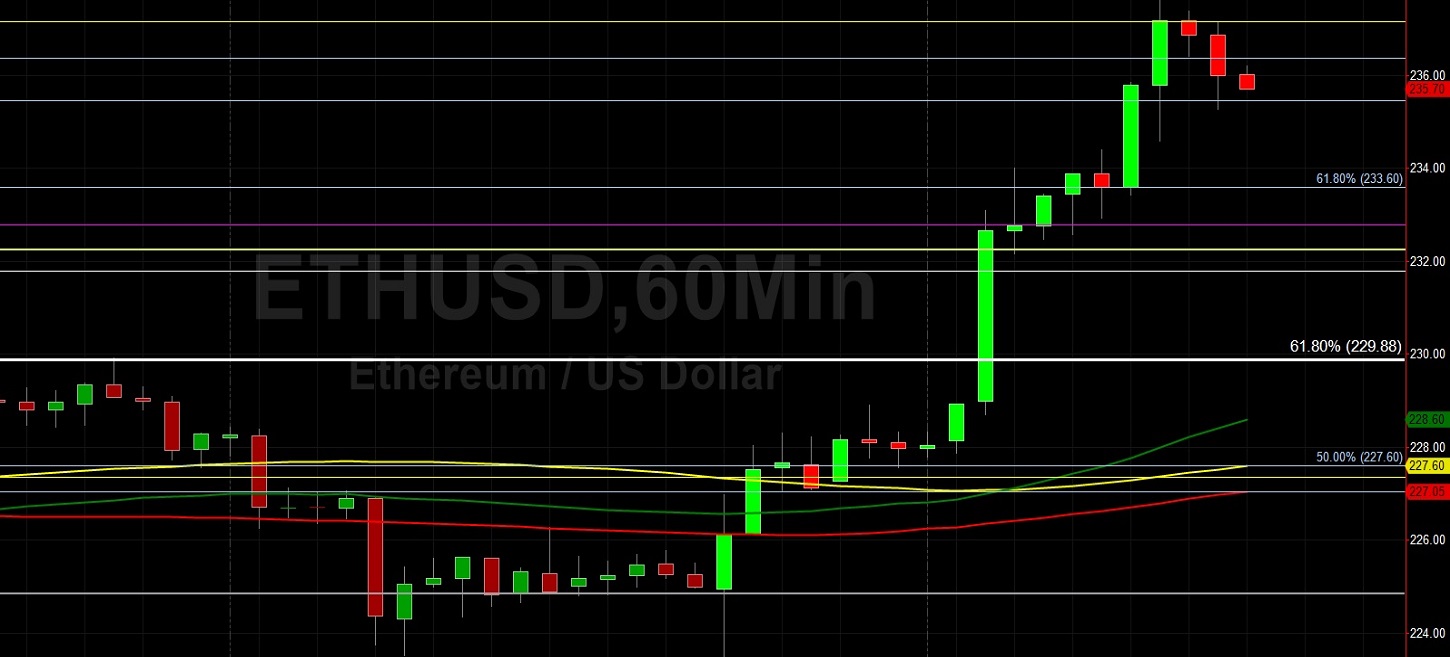
Ethereum (ETH/USD) extended yesterday’s gains early in the North American session as the pair traded as high as the 237.63 area before settling back to the 236.11 level. Stong buying pressure emerged around the 223.50 area during the Asian session, and significant Stops were elected above the 234.38 area, representing the 50% retracement of the recent depreciation from 253.60 to 215.16. Stops were also reached above the 228.70 area, representing the 23.6% retracement of the recent appreciation from 148.08 to 253.60. Additional Stops were triggered above the 236.10 area, representing the 61.8% retracement of the depreciation from 249.04 to 215.16. Traders are observing some decent technical resistance around the 238.90 area, and if ETH/USD is able to get above this area, some additional upside technical retracement levels including the 241.04 and 244.53 areas. Below current price activity, traders are waiting to see what will happen around the 222.95 area, representing the 23.6% retracement of the recent appreciation from 123.72 to 253.60. Above the recent market high, traders are eyeing the 247.61 level as another hurdle with some Stops likely in place above.
Significant buying pressure was recently seen that lifted ETH/USD through Stops above the 231.25, 232.61, and 234.29 levels, representing the 50%, 61.8%, and 76.4% retracements of the recent depreciation from 237.00 to 225.50. Further above recent price activity, upside price objectives include the 260.23 and 262.90 areas. Appreciating ranges that are technically significant include the move from 148.08 to 227.50, the move from 123.72 to 227.50, the move from 176.43 to 216.99, the appreciation from 90.00 to 227.50, and the appreciation from 196.65 to 253.60. Important technical levels related to those ranges include the 240.16, 231.85, 225.13, 208.76, 203.01, 197.16, 195.10, 187.79, and 175.02 levels, and traders are very interested to observe how price activity reacts around these levels. Chartists are observing that the 50-bar MA (4-hourly) is bearishly indicating below the 200-bar MA (4-hourly) and below the 100-bar MA (4-hourly). Also, the 50-bar MA (hourly) is bullishly indicating above the 100-bar MA (hourly) and above the 200-bar MA (hourly).
Price activity is nearest the 200-bar MA (4-hourly) at 233.85 and the 50-bar MA (Hourly) at 228.42.
Technical Support is expected around 213.66/ 206.29/ 191.27 with Stops expected below.
Technical Resistance is expected around 238.05/ 243.85/ 253.60 with Stops expected above.
On 4-Hourly chart, SlowK is Bullishly above SlowD while MACD is Bullishly above MACDAverage.
On 60-minute chart, SlowK is Bearishly below SlowD while MACD is Bullishly above MACDAverage.