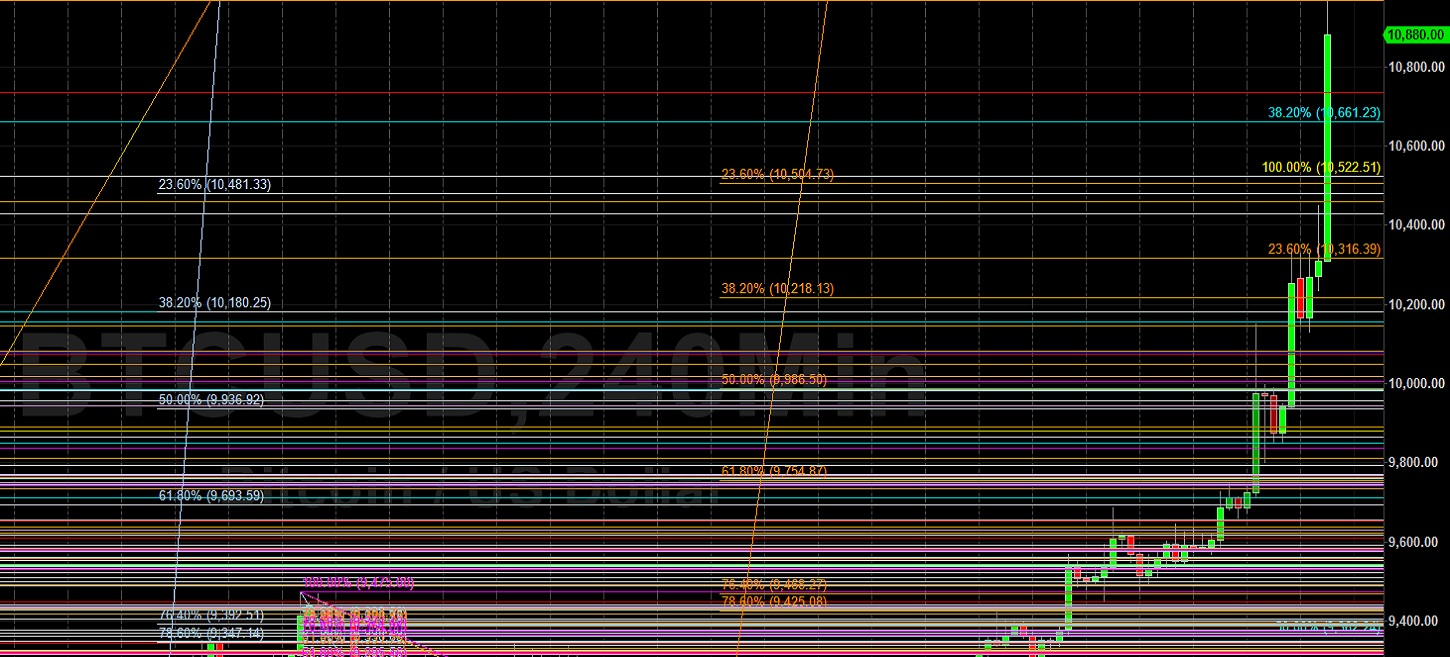
Bitcoin (BTC/USD) extended its rampage higher early in today’s Asian session as traders continued to push the pair closer to the psychologically-important 11000 figure following its swift moves and acceleration through the 10000 and 10500 levels. The pair traded as high as the 10968.00 area during yesterday’s North American session before briefly giving back some intraday gains. Traders have lifted the pair above some historical levels of technical significance in recent days, including the 9532.39, 9772.95, 9948.12, 10260.38, and 10354.90 levels. Stops have recently been elected above the 10268.38, 10276.29, 10354.90, 10615.49, 10647.72, and 10816.43 levels. If BTC/USD is able to continue its recent upward trajectory, traders will pay close attention to upside price objectives including the 11026.97, 11115.62, 11340.92, 11399.17, 11407.81, 11510.44, and 11604.29 areas. Following BTC/USD’s move higher to the 10968.00 area, updated levels of technical support include the 10522.51, 10504.73, 10481.33, 10459.89, 10316.39, 10218.13, 10180.25, and 10145.56 areas. Traders are closely monitoring recent depreciating ranges including the move from 9792.00 to 8815.01, the move from 10018.67 to 8815.01, and the depreciation from 10428.00 to 8815.01. Important technical levels related to these depreciating ranges include the 9416.84, 9418.79, 9561.43, 9558.87, 9582.92, 9621.51, 9734.61, 9761.09, 9811.84, 10047.33, and 10082.82 areas.
A recent appreciating range that traders are monitoring is the move from 8632.93 to 10428.00, with the 9530.47 and 9742.28 areas representing the 50% and 38.2% retracements of this appreciation. Below current price activity, Stops have been absorbed below the 8877.48 area, a level that represents the 23.6% retracement of the recent appreciation from 3858 to 10428. Additional downside areas of potential technical support include the 8993.44, 8695.01, 8680.35, 8654.53, and 8603.46 levels. Traders are also paying attention to multiple trading ranges including the recent appreciation from 8106.70 to 9957.25, the appreciation from 6456.00 to 10079.00, the appreciation from 5678.20 to 10079.00, the broader appreciation from 3858.00 to 10079.00, and the appreciation from 8632.93 to 10428.00. Important technical levels related to these ranges include 9530.47, 9318.65, 9040.41, 9025.32, 8808.52, 8695.01, 8610.84, 8540.29, 8398.89, 8267.50, 7878.60, 7839.99, 7702.58, 7359.31, and others. Chartists are observing that the 50-bar MA (4-hourly) is bullishly indicating above the 200-bar MA (4-hourly) and above the 100-bar MA (4-hourly). Also, the 50-bar MA (hourly) is bullishly indicating above the 200-bar MA (hourly) and above the 100-bar MA (hourly).
Price activity is nearest the 50-bar MA (4-hourly) at 9562.40 and the 50-bar MA (Hourly) at 9981.49.
Technical Support is expected around 10481.33/ 10268.38/ 9879.78 with Stops expected below.
Technical Resistance is expected around 11026.97/ 11115.62/ 11340.92 with Stops expected above.
On 4-Hourly chart, SlowK is Bullishly above SlowD while MACD is Bullishly above MACDAverage.
On 60-minute chart, SlowK is Bearishly below SlowD while MACD is Bullishly above MACDAverage.