Bitcoin (BTC/USD) remained on the offensive early in today’s Asian session as traders continued to observe the psychologically-important 10000 figure following the pair’s rampage higher to the 10150.00 area during yesterday’s European session, its strongest print since early June. Traders finally encountered technical resistance just below the 10154.71 area, representing the 76.4% retracement of a previous depreciating range from 10428.00 to 9270.00. Above that area, the 10180.19 area represents the 78.6% retracement of the same depreciating range. If BTC/USD bulls are able to resume their upward trajectory, traders will pay close attention to additional technical resistance that is likely in place around the 10268.38, 10276.29, 10354.90, 10615.49, 10647.72, and 10816.43 levels. Following BTC/USD’s move higher to the 10150.00 area, updated levels of technical support include the 9879.78, 9856.38, 9834.94, 9712.61, 9674.63, 9640.03, 9577.50, 9527.92, and 9472.51 areas. Traders are closely monitoring recent depreciating ranges including the move from 9792.00 to 8815.01, the move from 10018.67 to 8815.01, and the depreciation from 10428.00 to 8815.01. Important technical levels related to these depreciating ranges include the 9416.84, 9418.79, 9561.43, 9558.87, 9582.92, 9621.51, 9734.61, 9761.09, 9811.84, 10047.33, and 10082.82 areas. A recent appreciating range that traders are monitoring is the move from 8632.93 to 10428.00, with the 9530.47 and 9742.28 areas representing the 50% and 38.2% retracements of this appreciation.
Below current price activity, Stops have been absorbed below the 8877.48 area, a level that represents the 23.6% retracement of the recent appreciation from 3858 to 10428. Additional downside areas of potential technical support include the 8993.44, 8695.01, 8680.35, 8654.53, and 8603.46 levels. Traders are also paying attention to multiple trading ranges including the recent appreciation from 8106.70 to 9957.25, the appreciation from 6456.00 to 10079.00, the appreciation from 5678.20 to 10079.00, the broader appreciation from 3858.00 to 10079.00, and the appreciation from 8632.93 to 10428.00. Important technical levels related to these ranges include 9530.47, 9318.65, 9040.41, 9025.32, 8808.52, 8695.01, 8610.84, 8540.29, 8398.89, 8267.50, 7878.60, 7839.99, 7702.58, 7359.31, and others. Chartists are observing that the 50-bar MA (4-hourly) is bullishly indicating above the 200-bar MA (4-hourly) and above the 100-bar MA (4-hourly). Also, the 50-bar MA (hourly) is bullishly indicating above the 200-bar MA (hourly) and above the 100-bar MA (hourly).
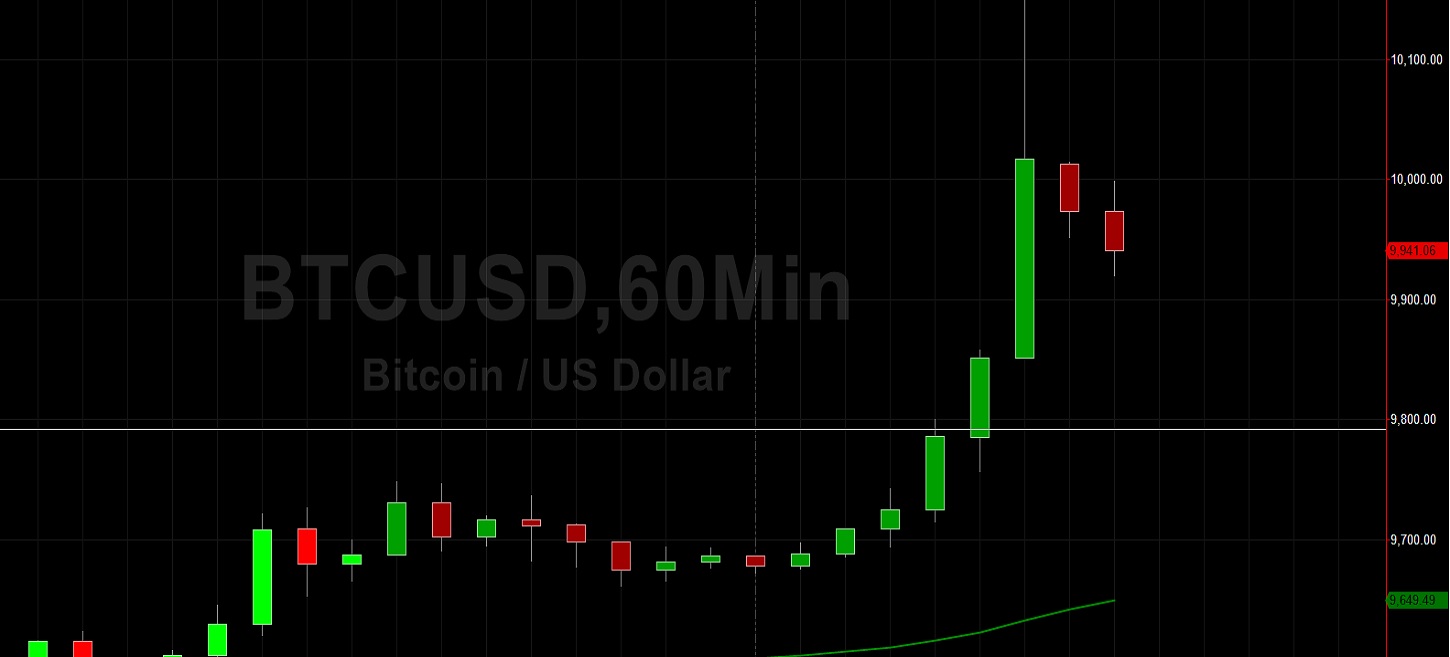
Price activity is nearest the 50-bar MA (4-hourly) at 9411.39 and the 50-bar MA (Hourly) at 9649.98.
Technical Support is expected around 9879.78/ 9834.94/ 9712.61 with Stops expected below.
Technical Resistance is expected around 10268.38/ 10354.90/ 10615.49 with Stops expected above.
On 4-Hourly chart, SlowK is Bearishly below SlowD while MACD is Bullishly above MACDAverage.
On 60-minute chart, SlowK is Bearishly below SlowD while MACD is Bullishly above MACDAverage.