Bitcoin (BTC/USD) extended recent gains above the psychologically-important 9000 figure early in today’s Asian session as bulls attempted to get back above the 9379.34 area that the pair peaked around earlier this week. Buying pressure emerged around the 9201.57 area during yesterday’s Asian session, a level it encountered when traders tested the 9198.46 area that represents the 38.2% retracement of the recent appreciation from 8905.84 to 9379.34. BTC/USD was capped in the short-term around the 9337.99 area, just below the 9338.59 area that represents the 78.6% retracement of the depreciation from 9375.90 to 9201.57. Traders are eyeing the 9418.79, 9516.43, and 9582.92 areas as upside price targets, as they represents the 61.8%, 76.4%, and 78.6% retracements of the recent depreciation from 9792.00 to 8815.01. Traders are closely monitoring three recent depreciating ranges including the move from 9792.00 to 8815.01, the move from 10018.67 to 8815.01, and the depreciation from 10428.00 to 8815.01. Important technical levels related to these depreciating ranges include the 9416.84, 9418.79, 9561.43, 9558.87, 9582.92, 9621.51, 9734.61, 9761.09, 9811.84, 10047.33, and 10082.82 areas. A recent appreciating range that traders are monitoring is the move from 8632.93 to 10428.00, with the 9530.47 and 9742.28 areas representing the 50% and 38.2% retracements of this appreciation. Following the pair’s recent movements, potential areas of technical support include the 9243.53, 9161.64, 9095.46, 9029.27, 8947.38, and 8935.04 levels.
Below current price activity, Stops have recently been absorbed below the 8877.48 area, a level that represents the 23.6% retracement of the recent appreciation from 3858 to 10428. Additional downside areas of potential technical support include the 8993.44, 8695.01, 8680.35, 8654.53, and 8603.46 levels. Traders are also paying attention to multiple trading ranges including the recent appreciation from 8106.70 to 9957.25, the appreciation from 6456.00 to 10079.00, the appreciation from 5678.20 to 10079.00, the broader appreciation from 3858.00 to 10079.00, and the appreciation from 8632.93 to 10428.00. Important technical levels related to these ranges include 9530.47, 9318.65, 9040.41, 9025.32, 8808.52, 8695.01, 8610.84, 8540.29, 8398.89, 8267.50, 7878.60, 7839.99, 7702.58, 7359.31, and others. Chartists are observing that the 50-bar MA (4-hourly) is bearishly indicating below the 100-bar MA (4-hourly) and below the 200-bar MA (4-hourly). Also, the 50-bar MA (hourly) is bullishly indicating above the 100-bar MA (hourly) and above the 200-bar MA (hourly).
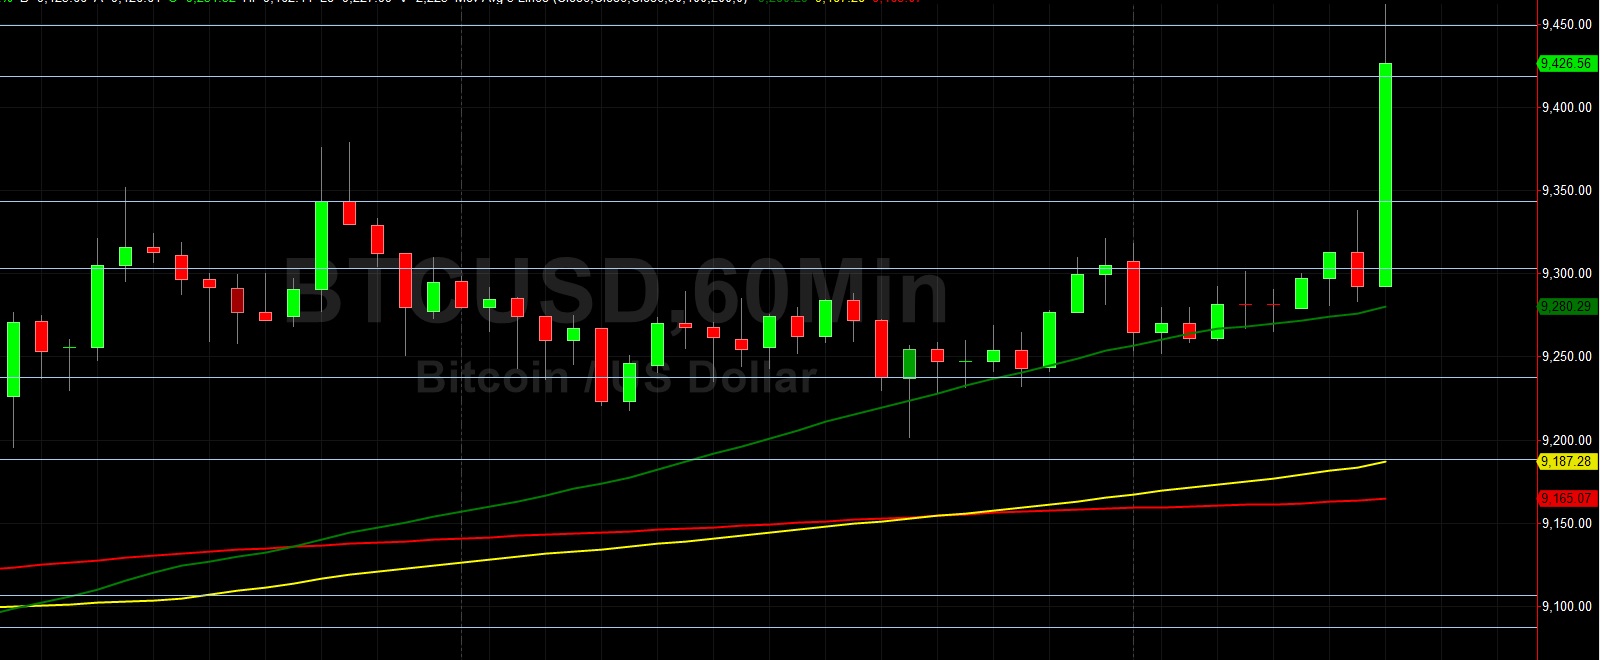
Price activity is nearest the 200-bar MA (4-hourly) at 9361.27 and the 50-bar MA (Hourly) at 9280.43.
Technical Support is expected around 8695.01/ 8540.29/ 8267.50 with Stops expected below.
Technical Resistance is expected around 9561.43/ 10066.21/ 10428.00 with Stops expected above.
On 4-Hourly chart, SlowK is Bullishly above SlowD while MACD is Bullishly above MACDAverage.
On 60-minute chart, SlowK is Bullishly above SlowD while MACD is Bullishly above MACDAverage.