Bitcoin (BTC/USD) lacked fresh conviction early in today’s Asian session as the pair continued to search for a market bias following its continued gyrations between the psychologically-important 9000 figure and the 9500 area. Strong upward momentum lifted the pair from the 9100 level in Tuesday’s European session, propelling it as high as the 9280 level before upward pressure subsided. Notably, the 9237.52 level represents the 23.6% retracement of this short-term appreciating range, and traders have been unable to gain a foothold above this area. Traders found some technical support during yesterday’s European session just below the 9190.42 area, representing the 50% retracement of the recent appreciation from 8905.84 to 9475.00. Some traders believe BTC/USD is exhibiting a downward bias given some of the recent resistance it has encountered, and a series of lower highs. Traders continue to view the 9516.43 and 9582.92 areas as upside price targets, as they represents the 76.4% and 78.6% retracements of the recent depreciation from 9792.00 to 8815.01. Traders are closely monitoring three recent depreciating ranges including the move from 9792.00 to 8815.01, the move from 10018.67 to 8815.01, and the depreciation from 10428.00 to 8815.01. Important technical levels related to these depreciating ranges include the 9416.84, 9418.79, 9561.43, 9558.87, 9582.92, 9621.51, 9734.61, 9761.09, 9811.84, 10047.33, and 10082.82 areas. A recent appreciating range that traders are monitoring is the move from 8632.93 to 10428.00, with the 9530.47 and 9742.28 areas representing the 50% and 38.2% retracements of this appreciation. Following the pair’s recent movements, potential areas of technical support include the 9123.26, 9067.13, 9040.16, and 8970.77 levels.
Below current price activity, Stops have recently been absorbed below the 8877.48 area, a level that represents the 23.6% retracement of the recent appreciation from 3858 to 10428. Additional downside areas of potential technical support include the 8993.44, 8695.01, 8680.35, 8654.53, and 8603.46 levels. Traders are also paying attention to multiple trading ranges including the recent appreciation from 8106.70 to 9957.25, the appreciation from 6456.00 to 10079.00, the appreciation from 5678.20 to 10079.00, the broader appreciation from 3858.00 to 10079.00, and the appreciation from 8632.93 to 10428.00. Important technical levels related to these ranges include 9530.47, 9318.65, 9040.41, 9025.32, 8808.52, 8695.01, 8610.84, 8540.29, 8398.89, 8267.50, 7878.60, 7839.99, 7702.58, 7359.31, and others. Chartists are observing that the 50-bar MA (4-hourly) is bearishly indicating below the 200-bar MA (4-hourly) and above the 100-bar MA (4-hourly). Also, the 50-bar MA (hourly) is bearishly indicating below the 200-bar MA (hourly) and below the 100-bar MA (hourly).
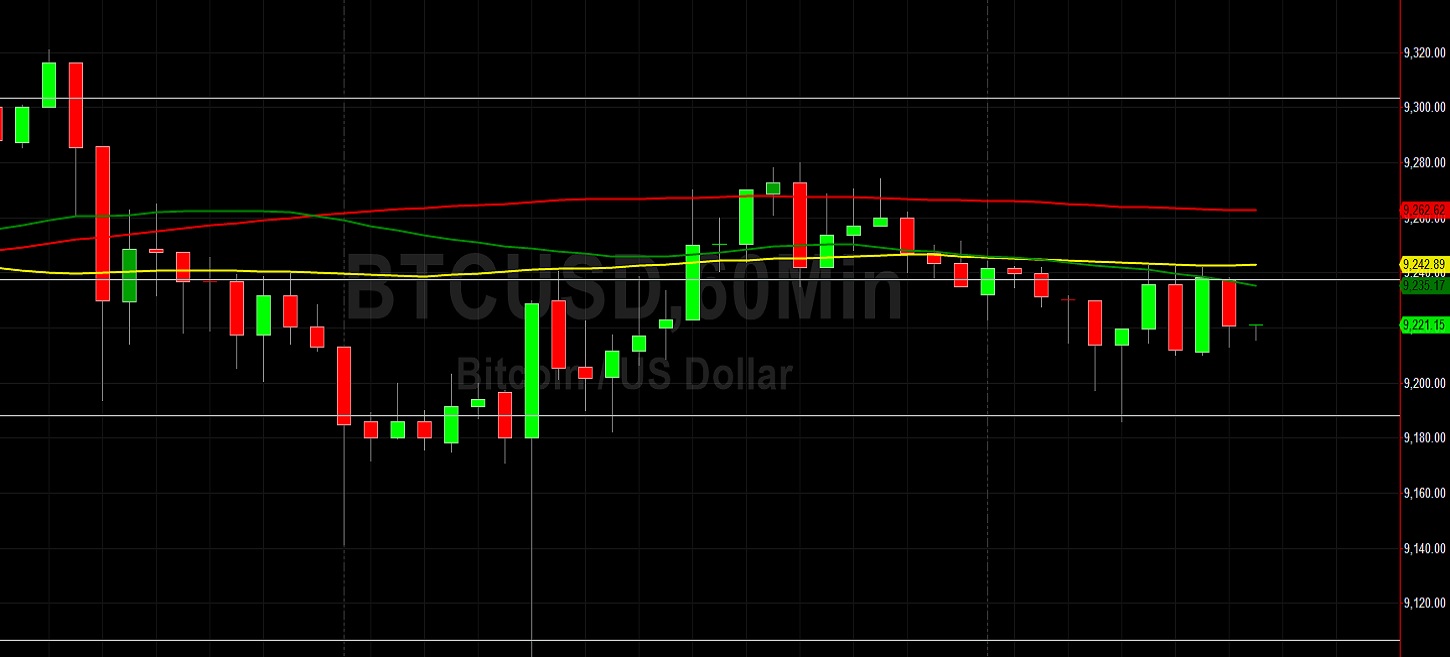
Price activity is nearest the 100-bar MA (4-hourly) at 9202.42 and the 50-bar MA (Hourly) at 9235.12.
Technical Support is expected around 8695.01/ 8540.29/ 8267.50 with Stops expected below.
Technical Resistance is expected around 9561.43/ 10066.21/ 10428.00 with Stops expected above.
On 4-Hourly chart, SlowK is Bearishly below SlowD while MACD is Bearishly below MACDAverage.
On 60-minute chart, SlowK is Bullishly above SlowD while MACD is Bearishly below MACDAverage.