Bitcoin (BTC/USD) remained on the defensive early in today’s Asian session as the pair continued to hover around the psychologically-important 9000 figure following modest selling pressure that intensified during yesterday’s Asian session. Traders sold the pair from the 9280 area mid-week and selling pressure later emerged around the 9243.25 area, representing the 38.2% retracement of the recent depreciation from 9475 to 9100. Decent Stops were elected below the 9123.26, 9040.16, and 9027.64 areas during the move lower, levels that represent the 61.8%, 76.4%, and 78.6% retracements of the recent appreciation from 8905.84 to 9475.00. Bids emerged around the 9005.00 area during yesterday’s European session as the pair stopped just short of testing the 8970.77 area, representing the 76.4% retracement of the recent appreciation from 8815.01 to 9475. Traders are closely monitoring three recent depreciating ranges including the move from 9792.00 to 8815.01, the move from 10018.67 to 8815.01, and the depreciation from 10428.00 to 8815.01. Important technical levels related to these depreciating ranges include the 9416.84, 9418.79, 9561.43, 9558.87, 9582.92, 9621.51, 9734.61, 9761.09, 9811.84, 10047.33, and 10082.82 areas. A recent appreciating range that traders are monitoring is the move from 8632.93 to 10428.00, with the 9530.47 and 9742.28 areas representing the 50% and 38.2% retracements of this appreciation.
Below current price activity, Stops have recently been absorbed below the 8877.48 area, a level that represents the 23.6% retracement of the recent appreciation from 3858 to 10428. Additional downside areas of potential technical support include the 8993.44, 8695.01, 8680.35, 8654.53, and 8603.46 levels. Traders are also paying attention to multiple trading ranges including the recent appreciation from 8106.70 to 9957.25, the appreciation from 6456.00 to 10079.00, the appreciation from 5678.20 to 10079.00, the broader appreciation from 3858.00 to 10079.00, and the appreciation from 8632.93 to 10428.00. Important technical levels related to these ranges include 9530.47, 9318.65, 9040.41, 9025.32, 8808.52, 8695.01, 8610.84, 8540.29, 8398.89, 8267.50, 7878.60, 7839.99, 7702.58, 7359.31, and others. Chartists are observing that the 50-bar MA (4-hourly) is bearishly indicating below the 200-bar MA (4-hourly) and above the 100-bar MA (4-hourly). Also, the 50-bar MA (hourly) is bearishly indicating below the 200-bar MA (hourly) and below the 100-bar MA (hourly).
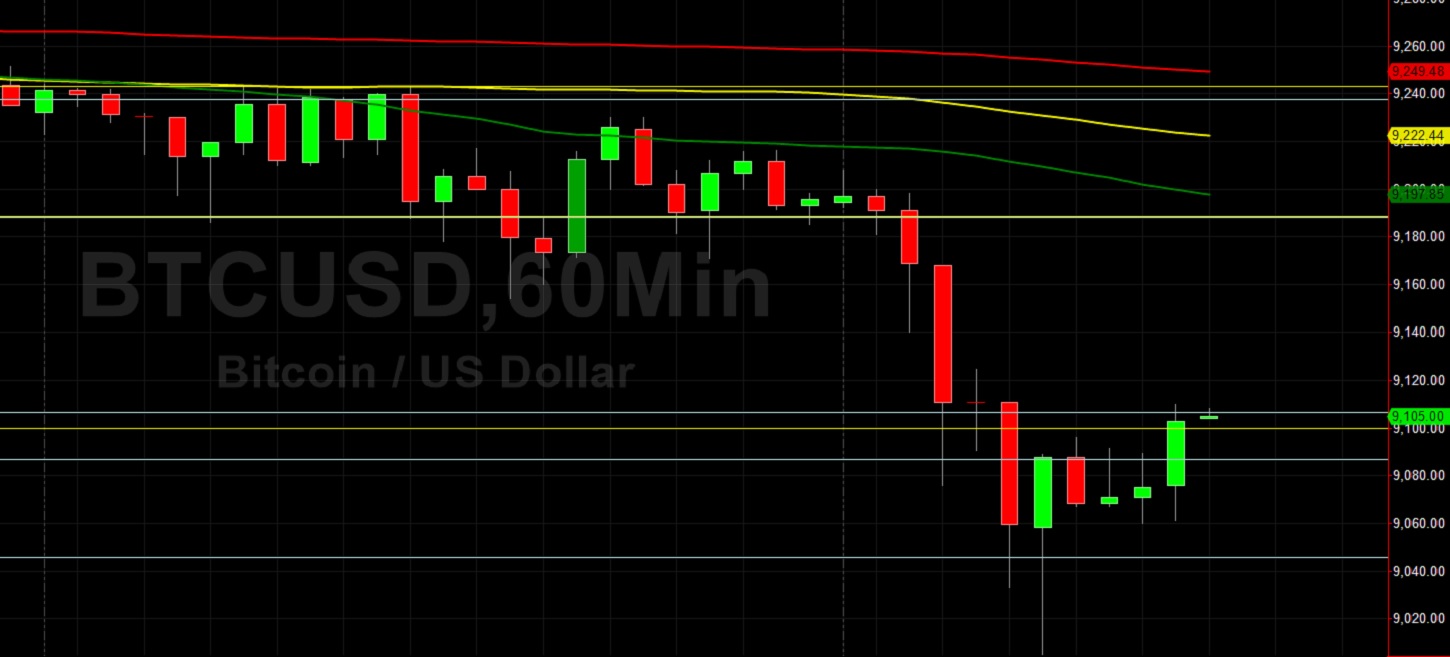
Price activity is nearest the 100-bar MA (4-hourly) at 9203.46 and the 50-bar MA (Hourly) at 9197.86.
Technical Support is expected around 8695.01/ 8540.29/ 8267.50 with Stops expected below.
Technical Resistance is expected around 9561.43/ 10066.21/ 10428.00 with Stops expected above.
On 4-Hourly chart, SlowK is Bearishly below SlowD while MACD is Bearishly below MACDAverage.
On 60-minute chart, SlowK is Bullishly above SlowD while MACD is Bearishly below MACDAverage.