Bitcoin (BTC/USD) lacked upside momentum early in today’s Asian session as the pair remained below the 9250 level after encountering resistance around the 9186.77 area during yesterday’s Asian session. Traders dumped the pair to the 9105.37 area during yesterday’s North American session, right around the 50% retracement of the recent appreciation from 9005.00 to 9210.00. The next downside retracement levels in the depreciating range include the 9083.31, 9053.38, and 9048.87 areas. Another important range that traders are carefully observing is the earlier depreciation from 9200 to 9005 where the 9110.05 and 9069.90 areas represent the 38.2% and 23.6% retracements. During the previous downturn, BTC/USD stopped just short of testing the 8970.77 area, representing the 76.4% retracement of the recent appreciation from 8815.01 to 9475. Traders are closely monitoring recent depreciating ranges including the move from 9792.00 to 8815.01, the move from 10018.67 to 8815.01, and the depreciation from 10428.00 to 8815.01. Important technical levels related to these depreciating ranges include the 9416.84, 9418.79, 9561.43, 9558.87, 9582.92, 9621.51, 9734.61, 9761.09, 9811.84, 10047.33, and 10082.82 areas. A recent appreciating range that traders are monitoring is the move from 8632.93 to 10428.00, with the 9530.47 and 9742.28 areas representing the 50% and 38.2% retracements of this appreciation.
Below current price activity, Stops have recently been absorbed below the 8877.48 area, a level that represents the 23.6% retracement of the recent appreciation from 3858 to 10428. Additional downside areas of potential technical support include the 8993.44, 8695.01, 8680.35, 8654.53, and 8603.46 levels. Traders are also paying attention to multiple trading ranges including the recent appreciation from 8106.70 to 9957.25, the appreciation from 6456.00 to 10079.00, the appreciation from 5678.20 to 10079.00, the broader appreciation from 3858.00 to 10079.00, and the appreciation from 8632.93 to 10428.00. Important technical levels related to these ranges include 9530.47, 9318.65, 9040.41, 9025.32, 8808.52, 8695.01, 8610.84, 8540.29, 8398.89, 8267.50, 7878.60, 7839.99, 7702.58, 7359.31, and others. Chartists are observing that the 50-bar MA (4-hourly) is bearishly indicating below the 200-bar MA (4-hourly) and below the 100-bar MA (4-hourly). Also, the 50-bar MA (hourly) is bearishly indicating below the 200-bar MA (hourly) and above the 100-bar MA (hourly).
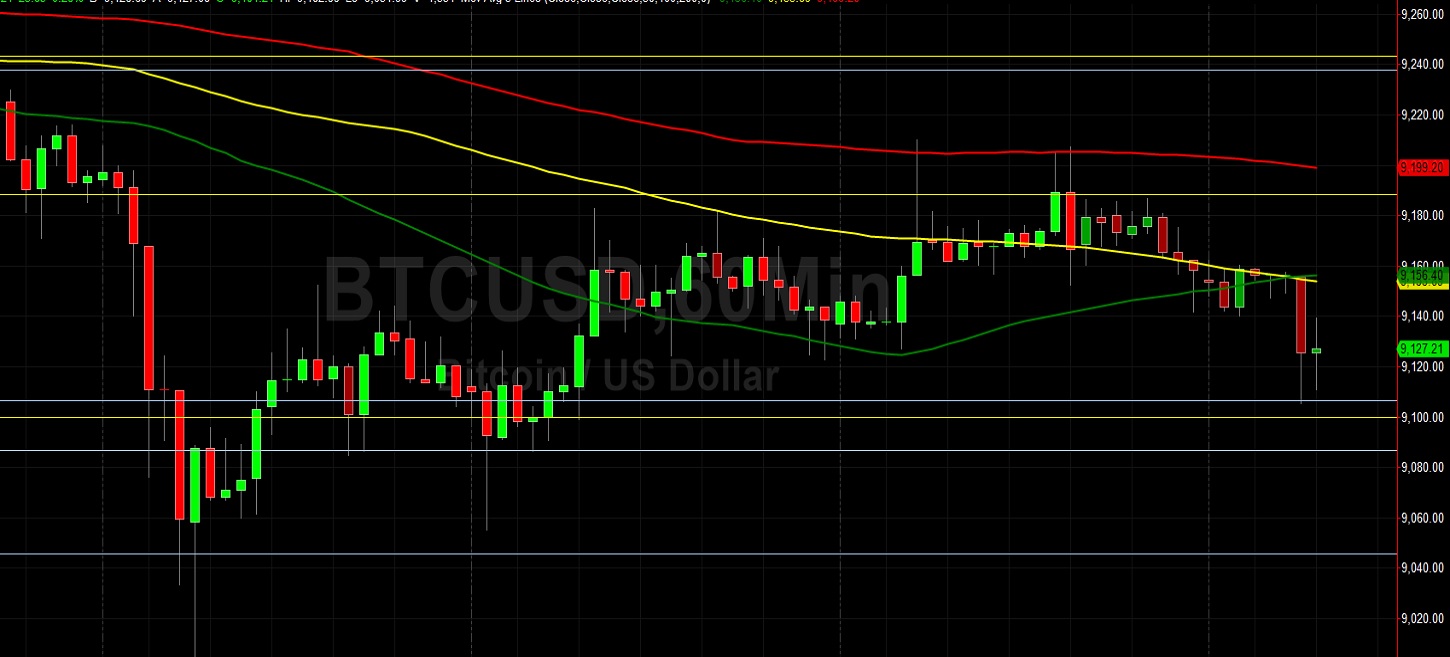
Price activity is nearest the 50-bar MA (4-hourly) at 9195.97 and the 100-bar MA (Hourly) at 9153.91.
Technical Support is expected around 8695.01/ 8540.29/ 8267.50 with Stops expected below.
Technical Resistance is expected around 9561.43/ 10066.21/ 10428.00 with Stops expected above.
On 4-Hourly chart, SlowK is Bullishly above SlowD while MACD is Bullishly above MACDAverage.
On 60-minute chart, SlowK is Bullishly above SlowD while MACD is Bearishly below MACDAverage.