Bitcoin (BTC/USD) added to its recent positive market bias early in today’s Asian session as traders continued to seek buying opportunities above the psychologically-important 9500 level after trading as high as the 9686 area late last week. Some traders are beginning to focus on the psychologically-important 10000 figure but BTC/USD has some significant technical resistance to move above before this area comes into view. One area of probable technical resistance is around the 9735.06 – 9761.54 range, representing the 76.4% and 78.6% retracements of the recent depreciation from 10019.12 to 8815.46. Likewise, the 9811.84 area is another level of technical resistance, representing the 61.8% retracement of the broader depreciating range from 10428.00 to 8815.01. Additional upside areas of technical resistance include the 9792.00, 9836.99, 9880.17, 9943.93, and 9957.25 levels. Following the pair’s recent climb, traders are paying close attention to some technical support areas on retracements lower including the 9525.28, 9425.86, 9345.50, 9265.14, and 9165.72 levels. Traders are closely monitoring recent depreciating ranges including the move from 9792.00 to 8815.01, the move from 10018.67 to 8815.01, and the depreciation from 10428.00 to 8815.01. Important technical levels related to these depreciating ranges include the 9416.84, 9418.79, 9561.43, 9558.87, 9582.92, 9621.51, 9734.61, 9761.09, 9811.84, 10047.33, and 10082.82 areas. A recent appreciating range that traders are monitoring is the move from 8632.93 to 10428.00, with the 9530.47 and 9742.28 areas representing the 50% and 38.2% retracements of this appreciation.
Below current price activity, Stops have been absorbed below the 8877.48 area, a level that represents the 23.6% retracement of the recent appreciation from 3858 to 10428. Additional downside areas of potential technical support include the 8993.44, 8695.01, 8680.35, 8654.53, and 8603.46 levels. Traders are also paying attention to multiple trading ranges including the recent appreciation from 8106.70 to 9957.25, the appreciation from 6456.00 to 10079.00, the appreciation from 5678.20 to 10079.00, the broader appreciation from 3858.00 to 10079.00, and the appreciation from 8632.93 to 10428.00. Important technical levels related to these ranges include 9530.47, 9318.65, 9040.41, 9025.32, 8808.52, 8695.01, 8610.84, 8540.29, 8398.89, 8267.50, 7878.60, 7839.99, 7702.58, 7359.31, and others. Chartists are observing that the 50-bar MA (4-hourly) is bullishly indicating above the 200-bar MA (4-hourly) and above the 100-bar MA (4-hourly). Also, the 50-bar MA (hourly) is bullishly indicating above the 200-bar MA (hourly) and above the 100-bar MA (hourly).
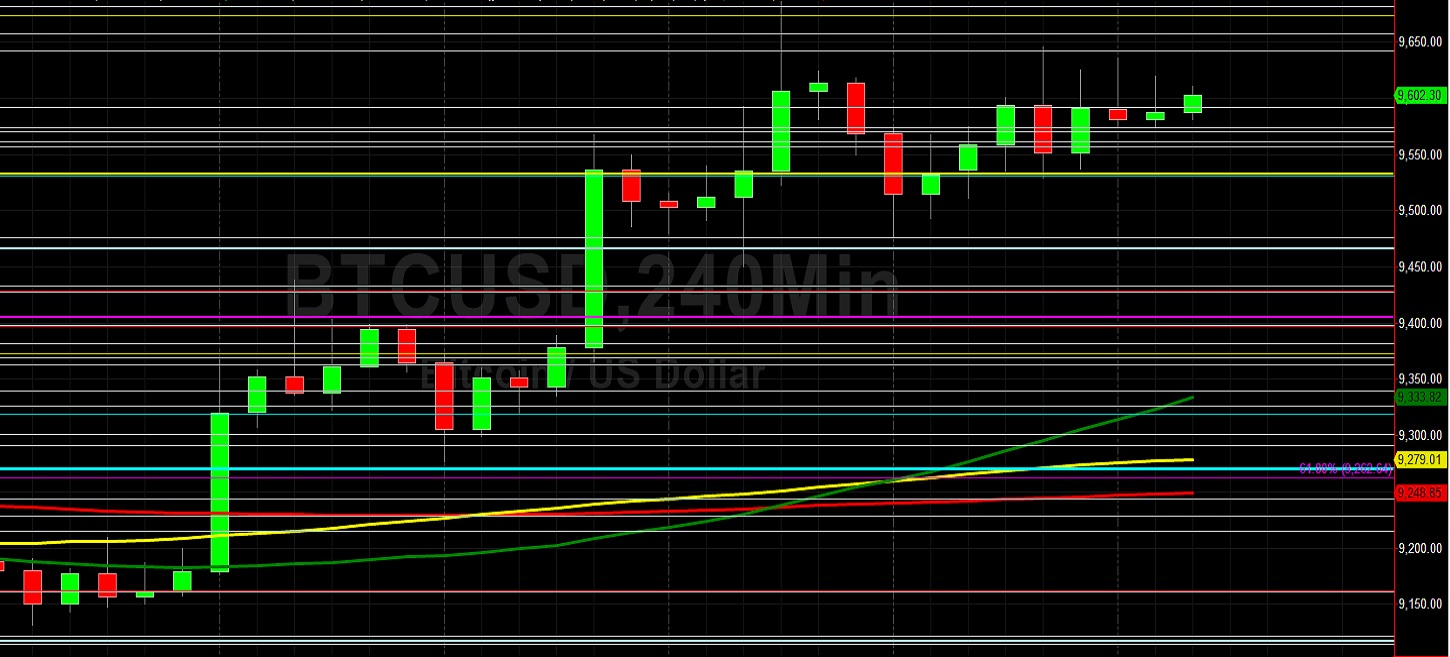
Price activity is nearest the 50-bar MA (4-hourly) at 9333.81 and the 50-bar MA (Hourly) at 9569.11.
Technical Support is expected around 9368.20/ 9143.70/ 8540.29 with Stops expected below.
Technical Resistance is expected around 9792.00/ 10066.21/ 10428.00 with Stops expected above.
On 4-Hourly chart, SlowK is Bearishly below SlowD while MACD is Bearishly below MACDAverage.
On 60-minute chart, SlowK is Bullishly above SlowD while MACD is Bearishly below MACDAverage.