Bitcoin (BTC/USD) sought new market sentiment early in today’s Asian session as the pair extended its recent sideways trading range, encountering short-term technical resistance below the 9500 level. Bids emerged around the 9346 area during yesterday’s Asian session, and traders have recently encountered some technical resistance around the 9490.61 level, an upside price objective related to bids that emerged around the 6456 area in April. Traders are trying to discern if market sentiment is likely to improve or worsen in the short-term. The 9028.89 area represents an important upside price objective related to buying pressure that emerged around the 3858 area earlier this year, and bids recently supported that level. Stops were recently reached below the 10004.36, 9742.28, 9530.47, and 9318.65 areas during the depreciation, retracement levels related to the recent appreciation from 8632.93 to 10428.00. Another very important range is the appreciation from 8106.70 to 10428.00, and Stops were triggered below some of its related retracement levels including the 9880.18 and 9541.26 areas.
Notably, the 9267.35 area represents the 50% retracement of this range, and traders were able to trigger Stops below this area during the recent rapid depreciation. Market sentiment appears to be weakening in the short-term, and this could result in another test of the psychologically-important 9000 figure. Traders are also paying attention to multiple trading ranges including the recent appreciation from 8106.70 to 9957.25, the appreciation from 6456.00 to 10079.00, the appreciation from 5678.20 to 10079.00, the broader appreciation from 3858.00 to 10079.00, and the appreciation from 8632.93 to 10428.00. Important technical levels related to these ranges include 9530.47, 9318.65, 9040.41, 9025.32, 8808.52, 8695.01, 8610.84, 8540.29, 8398.89, 8267.50, 7878.60, 7839.99, 7702.58, 7359.31, and others. Chartists are observing that the 50-bar MA (4-hourly) is bearishly indicating below the 100-bar MA (4-hourly) and above the 200-bar MA (4-hourly). Also, the 50-bar MA (hourly) is bearishly indicating below the 100-bar MA (hourly) and below the 200-bar MA (hourly).
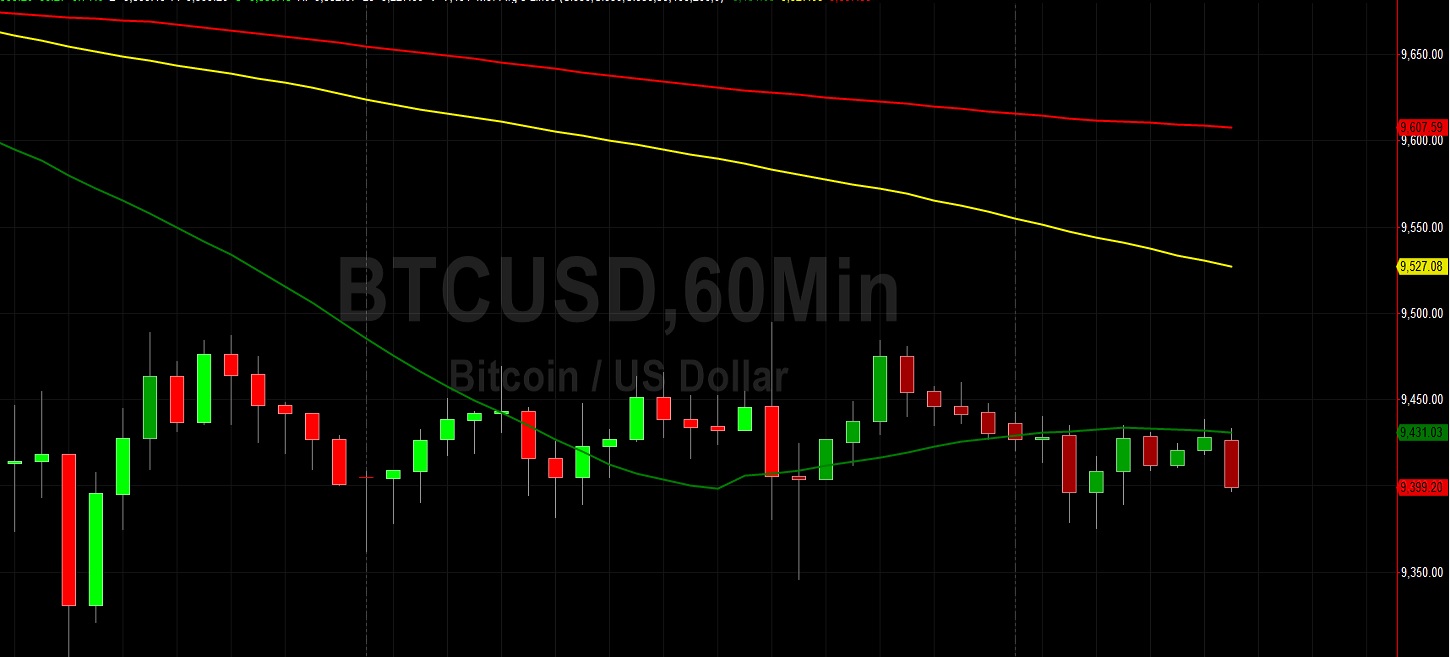
Price activity is nearest the 200-bar MA (4-hourly) at 9450.20 and the 50-bar MA (Hourly) at 9431.03.
Technical Support is expected around 8695.01/ 8540.29/ 8267.50 with Stops expected below.
Technical Resistance is expected around 10428.00/ 10661.23/ 10735.13 with Stops expected above.
On 4-Hourly chart, SlowK is Bearishly below SlowD while MACD is Bullishly above MACDAverage.
On 60-minute chart, SlowK is Bearishly below SlowD while MACD is Bearishly below MACDAverage.