Bitcoin (BTC/USD) extended its recent weakness early in today’s Asian session as the pair remained pressured around the 9000 figure after trading as low as the 8895.01 area during yesterday’s European session. Stops were elected below the 8993.44 area during the pullback, representing the 61.8% retracement of the appreciation from 8106.70 to 10428. More Stops were triggered below the 8910.70 area, an upside price objective related to buying pressure that emerged around the 6456 area in April, after Stops were reached below the 9028.89 area, an upside price objective related to buying pressure the originated around the 3858 area. Additional important technical levels include the 9214.67 and 9040.41 areas, and Stops were also reached below these levels. Traders are carefully observing the 8763.44 and 8695.01 levels during additional moves lower.
Market sentiment appears to be weakening in the short-term, and this could result in another test of the psychologically-important 9000 figure. Traders are also paying attention to multiple trading ranges including the recent appreciation from 8106.70 to 9957.25, the appreciation from 6456.00 to 10079.00, the appreciation from 5678.20 to 10079.00, the broader appreciation from 3858.00 to 10079.00, and the appreciation from 8632.93 to 10428.00. Important technical levels related to these ranges include 9530.47, 9318.65, 9040.41, 9025.32, 8808.52, 8695.01, 8610.84, 8540.29, 8398.89, 8267.50, 7878.60, 7839.99, 7702.58, 7359.31, and others. Chartists are observing that the 50-bar MA (4-hourly) is bearishly indicating below the 100-bar MA (4-hourly) and above the 200-bar MA (4-hourly). Also, the 50-bar MA (hourly) is bearishly indicating below the 100-bar MA (hourly) and below the 200-bar MA (hourly).
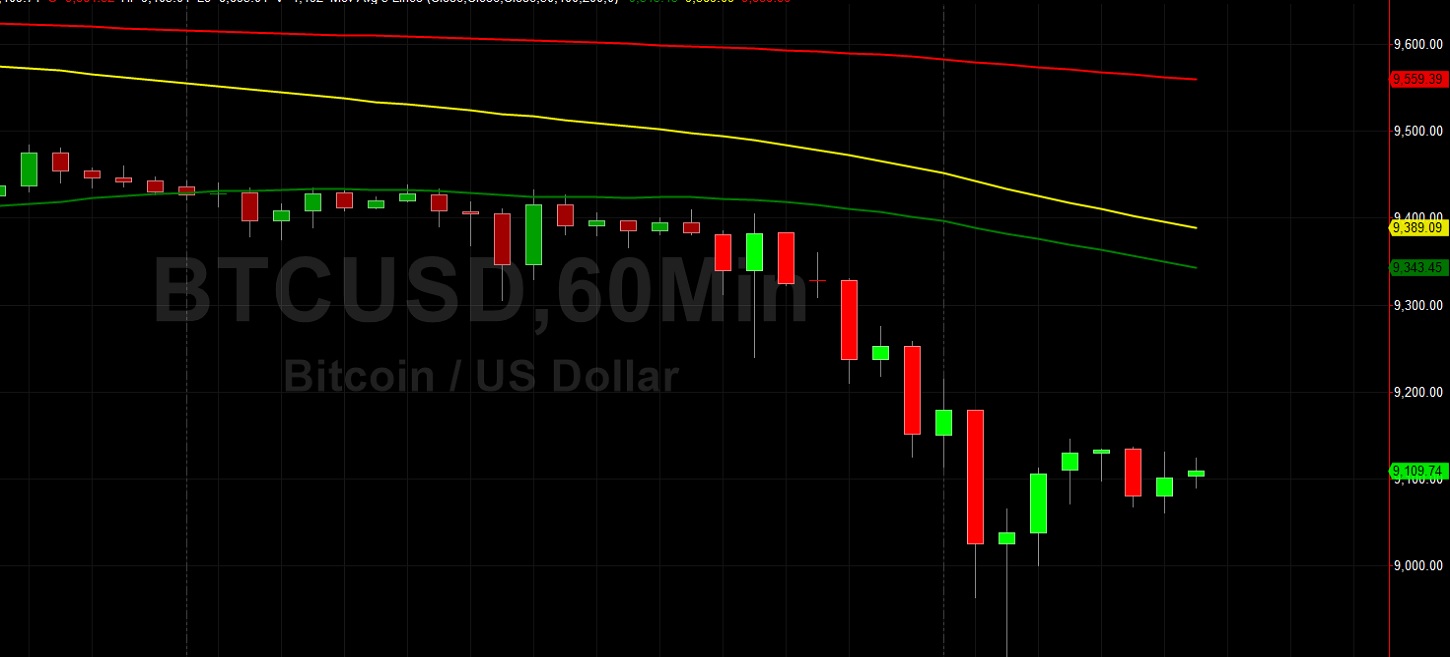
Price activity is nearest the 200-bar MA (4-hourly) at 9463.57 and the 50-bar MA (Hourly) at 9343.38.
Technical Support is expected around 8695.01/ 8540.29/ 8267.50 with Stops expected below.
Technical Resistance is expected around 10428.00/ 10661.23/ 10735.13 with Stops expected above.
On 4-Hourly chart, SlowK is Bullishly above SlowD while MACD is Bearishly below MACDAverage.
On 60-minute chart, SlowK is Bearishly below SlowD while MACD is Bearishly below MACDAverage.