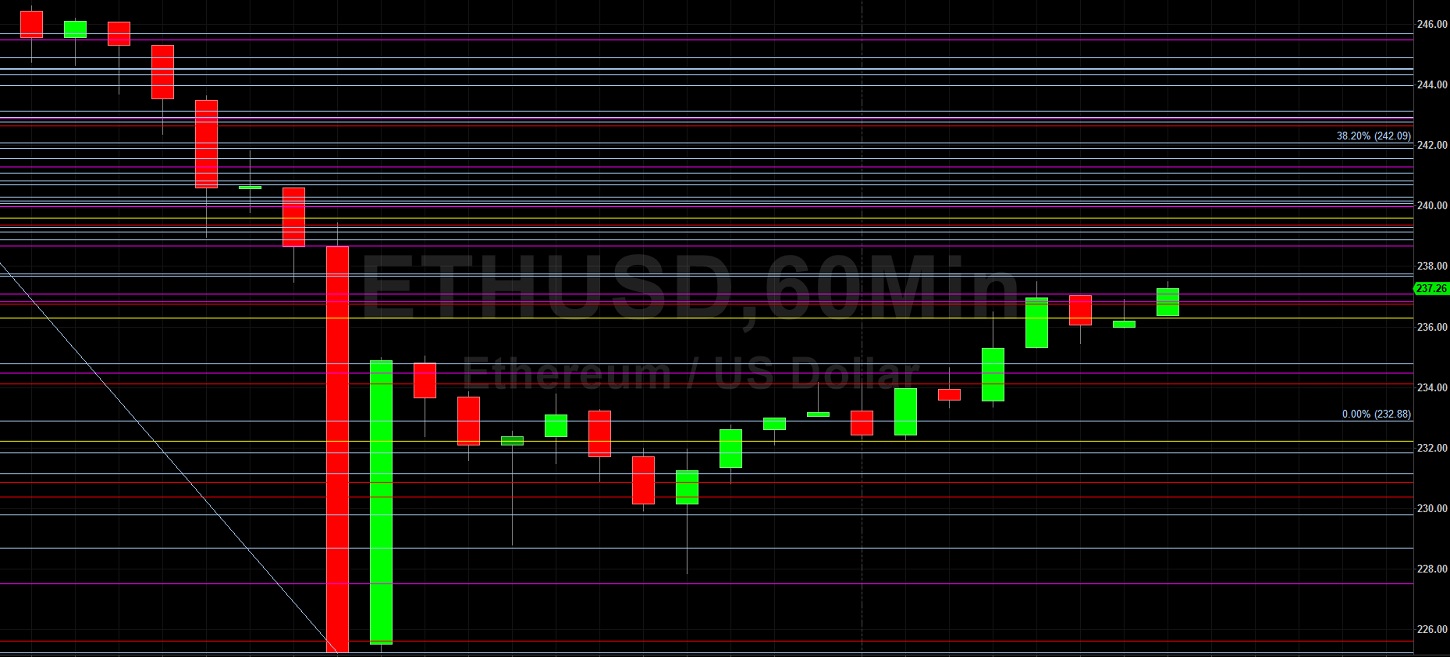
Ethereum (ETH/USD) extended earlier gains during today’s North American session as the pair gained ground to the 237.27 level after trading as low as the 225.20 area during yesterday’s North American session. Traders pushed the pair decisively lower yesterday, with bids emerging right around the 50% retracement of the recent appreciation from 196.65 to 253.60. Buying pressure emerged and prevented the pair from testing the 222.95 area, representing the 23.6% retracement of the recent broader appreciation from 123.72 to 253.60. Traders are carefully monitoring some upside retracement levels including the 237.75, 240.70, and 244.35 areas, representing the 50%, 61.8%, and 76.4% retracements of the recent depreciation from 250.26 to 225.23. Above recent price activity, upside price objectives include the 260.23 and 262.90 areas. Recently, Stops were elected above the 216.99 and 227.50 areas and traders will pay close attention to how price activity reacts around these areas.
Appreciating ranges that are technically significant include the move from 148.08 to 227.50, the move from 123.72 to 227.50, the move from 176.43 to 216.99, the appreciation from 90.00 to 227.50, and the appreciation from 196.65 to 253.60. Important technical levels related to those ranges include the 240.16, 231.85, 225.13, 208.76, 203.01, 197.16, 195.10, 187.79, and 175.02 levels, and traders are very interested to observe how price activity reacts around these levels. Below current market activity, traders continue to monitor the 196.56 and 177.39 levels as downside price targets, both of which relate to selling pressure that emerged around the 253.01 area in early March. Additional downside areas of potential technical support include the 190.93, 186.00, 185.39, and 185.11 areas. Chartists are observing that the 50-bar MA (4-hourly) is bullishly indicating above the 100-bar MA (4-hourly) and above the 200-bar MA (4-hourly). Also, the 50-bar MA (hourly) is bearishly indicating below the 100-bar MA (hourly) and below the 200-bar MA (hourly).
Price activity is nearest the 100-bar MA (4-hourly) at 236.30 and the 50-bar MA (Hourly) at 240.52.
Technical Support is expected around 213.66/ 206.29/ 191.27 with Stops expected below.
Technical Resistance is expected around 253.60/ 260.23/ 278.02 with Stops expected above.
On 4-Hourly chart, SlowK is Bullishly above SlowD while MACD is Bearishly below MACDAverage.
On 60-minute chart, SlowK is Bullishly above SlowD while MACD is Bullishly above MACDAverage.