Ethereum (ETH/USD) weakened early in today’s North American session as the pair came off to the 222.33 area after encountering selling pressure around the 224.28 area during the European session. Traders were unable to take the pair much above the 224.13 level during the slight bump higher during the European session, a level that represents the 50% retracement of the depreciation from 227.27 to 220.98. The paid peaked around the 227.93 area during yesterday’s North American session, below the 228.10 area that represents the 38.2% retracement of the recent depreciation from 249.04 to 215.16. If selling pressure resumes, traders are observing the 205.98 and 204.61 areas as downside targets, and some Stops are likely in place below the 213.29 area. Traders observe that the 228.70 area is technically significant as it represents the 23.6% retracement of the recent appreciation from 148.08 to 253.60. Above the recent market high, traders are eyeing the 247.61 level as another hurdle with some Stops likely in place above. Significant buying pressure was recently seen that lifted ETH/USD through Stops above the 231.25, 232.61, and 234.29 levels, representing the 50%, 61.8%, and 76.4% retracements of the recent depreciation from 237.00 to 225.50. Above recent price activity, upside price objectives include the 260.23 and 262.90 areas.
Appreciating ranges that are technically significant include the move from 148.08 to 227.50, the move from 123.72 to 227.50, the move from 176.43 to 216.99, the appreciation from 90.00 to 227.50, and the appreciation from 196.65 to 253.60. Important technical levels related to those ranges include the 240.16, 231.85, 225.13, 208.76, 203.01, 197.16, 195.10, 187.79, and 175.02 levels, and traders are very interested to observe how price activity reacts around these levels. Below current market activity, traders continue to monitor the 196.56 and 177.39 levels as downside price targets, both of which relate to selling pressure that emerged around the 253.01 area in early March. Additional downside areas of potential technical support include the 190.93, 186.00, 185.39, and 185.11 areas. Recently, ETH/USD briefly traded below the 218.40 area, representing the 61.8% retracement of the appreciating range from 196.65 to 253.60. The next upside price retracement level in this range is the 240.16 level. Chartists are observing that the 50-bar MA (4-hourly) is bearishly indicating below the 200-bar MA (4-hourly) and above the 100-bar MA (4-hourly). Also, the 50-bar MA (hourly) is bearishly indicating below the 100-bar MA (hourly) and below the 200-bar MA (hourly).
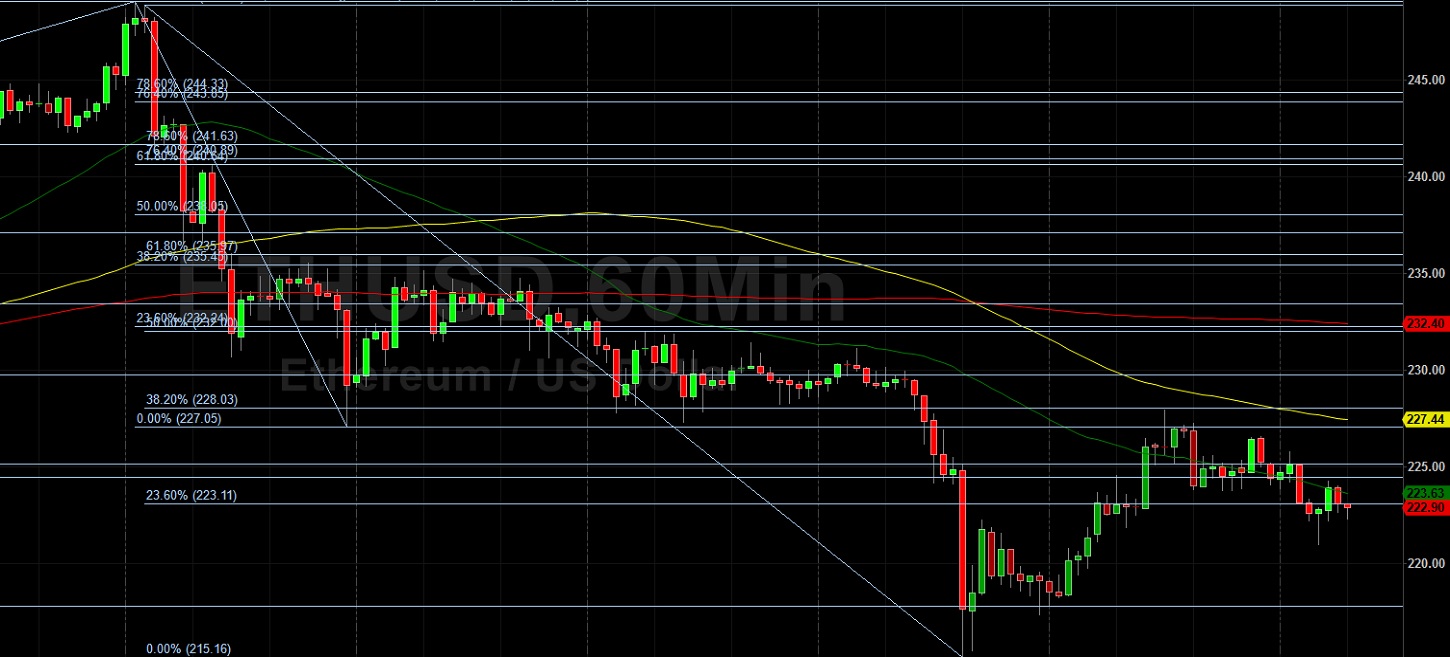
Price activity is nearest the 100-bar MA (4-hourly) at 231.97 and the 50-bar MA (Hourly) at 223.62.
Technical Support is expected around 213.66/ 206.29/ 191.27 with Stops expected below.
Technical Resistance is expected around 238.05/ 243.85/ 253.60 with Stops expected above.
On 4-Hourly chart, SlowK is Bearishly below SlowD while MACD is Bullishly above MACDAverage.
On 60-minute chart, SlowK is Bullishly above SlowD while MACD is Bearishly below MACDAverage.