Bitcoin (BTC/USD) continued to experience volatility early in today’s Asian session as the pair remained pressured below the 9500 level after trading as low as the 8979.07 area during yesterday’s Asian session, its weakest print since 15 June. Stops were elected below the 9106.70 and 9086.97 areas during the sharp depreciation, representing the 76.4% and 78.6% retracements of the recent appreciation from 8895.01 to 9792.00. Larger Stops were triggered below the 9056.57 and 9017.07 areas, representing the 76.4% and 78.6% retracements of the broader appreciation from 8632.93 to 10428.00. Below current market activity, Stops were recently elected below the 8993.44 area during the pullback, representing the 61.8% retracement of the appreciation from 8106.70 to 10428, and additional Stops were triggered below the 8910.70 area, an upside price objective related to buying pressure that emerged around the 6456 area in April. Traders are curious to see BTC/USD reacts around these levels when the market retests these areas.
Moreover, Stops were reached below the 9028.89 area, an upside price objective related to buying pressure the originated around the 3858 area. Traders are carefully observing the 8763.44 and 8695.01 levels during additional moves lower. Traders are also paying attention to multiple trading ranges including the recent appreciation from 8106.70 to 9957.25, the appreciation from 6456.00 to 10079.00, the appreciation from 5678.20 to 10079.00, the broader appreciation from 3858.00 to 10079.00, and the appreciation from 8632.93 to 10428.00. Important technical levels related to these ranges include 9530.47, 9318.65, 9040.41, 9025.32, 8808.52, 8695.01, 8610.84, 8540.29, 8398.89, 8267.50, 7878.60, 7839.99, 7702.58, 7359.31, and others. Chartists are observing that the 50-bar MA (4-hourly) is bearishly indicating below the 100-bar MA (4-hourly) and below the 200-bar MA (4-hourly). Also, the 50-bar MA (hourly) is bullishly indicating above the 100-bar MA (hourly) and above the 200-bar MA (hourly).
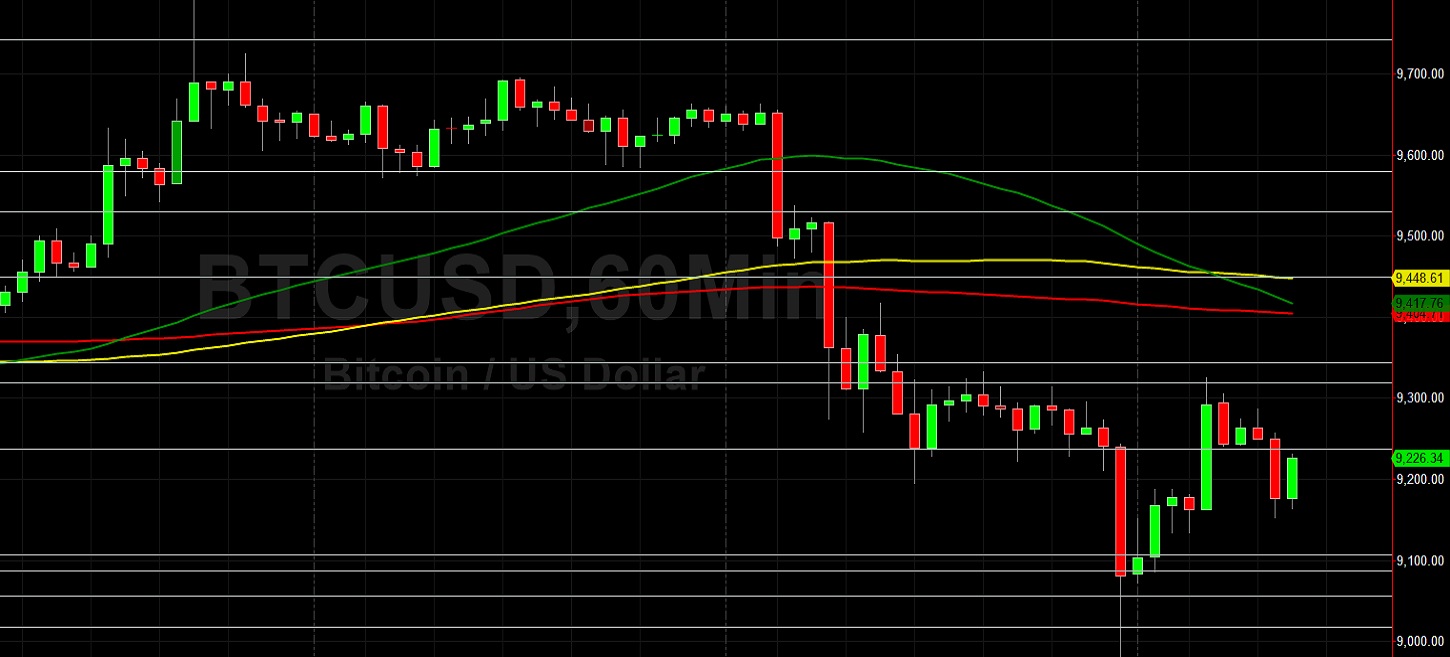
Price activity is nearest the 50-bar MA (4-hourly) at 9394.38 and the 200-bar MA (Hourly) at 9404.69.
Technical Support is expected around 8695.01/ 8540.29/ 8267.50 with Stops expected below.
Technical Resistance is expected around 10428.00/ 10661.23/ 10735.13 with Stops expected above.
On 4-Hourly chart, SlowK is Bullishly above SlowD while MACD is Bearishly below MACDAverage.
On 60-minute chart, SlowK is Bearishly below SlowD while MACD is Bullishly above MACDAverage.