Bitcoin (BTC/USD) continued to orbit the 9000 figure early in today’s Asian session as the pair continued to recover from its move to the 8815.01 area during Saturday’s North American session, its weakest print since late May. Stops were elected below the 8993.44 area during the descent lower, a retracement level that represents the 61.8% retracement of the appreciation from 8106.70 to 10428.00. The next downside price retracement levels in this appreciating range include the 8654.53 and 8603.46 levels. Additional Stops were triggered below the 8910.70 area, representing the 38.2% retracement of the appreciation from 6456 to 10428. Larger Stops were absorbed below the 8877.48 area, a level that represents the 23.6% retracement of the recent appreciation from 3858 to 10428. Recently resistance has been below the 9385.54 area, representing the 50% retracement of the recent depreciation from 9792.00 to 8979.07. Relatively large Stops were also triggered below the 9056.57 and 9017.07 areas, representing the 76.4% and 78.6% retracements of the broader appreciation from 8632.93 to 10428.00.
Below current market activity, Stops were recently elected below the 8993.44 area during the pullback, representing the 61.8% retracement of the appreciation from 8106.70 to 10428, and additional Stops were triggered below the 8910.70 area, an upside price objective related to buying pressure that emerged around the 6456 area in April. Traders are carefully observing the 8763.44 and 8695.01 levels during additional moves lower. Traders are also paying attention to multiple trading ranges including the recent appreciation from 8106.70 to 9957.25, the appreciation from 6456.00 to 10079.00, the appreciation from 5678.20 to 10079.00, the broader appreciation from 3858.00 to 10079.00, and the appreciation from 8632.93 to 10428.00. Important technical levels related to these ranges include 9530.47, 9318.65, 9040.41, 9025.32, 8808.52, 8695.01, 8610.84, 8540.29, 8398.89, 8267.50, 7878.60, 7839.99, 7702.58, 7359.31, and others. Chartists are observing that the 50-bar MA (4-hourly) is bearishly indicating below the 100-bar MA (4-hourly) and below the 200-bar MA (4-hourly). Also, the 50-bar MA (hourly) is bearishly indicating below the 100-bar MA (hourly) and below the 200-bar MA (hourly).
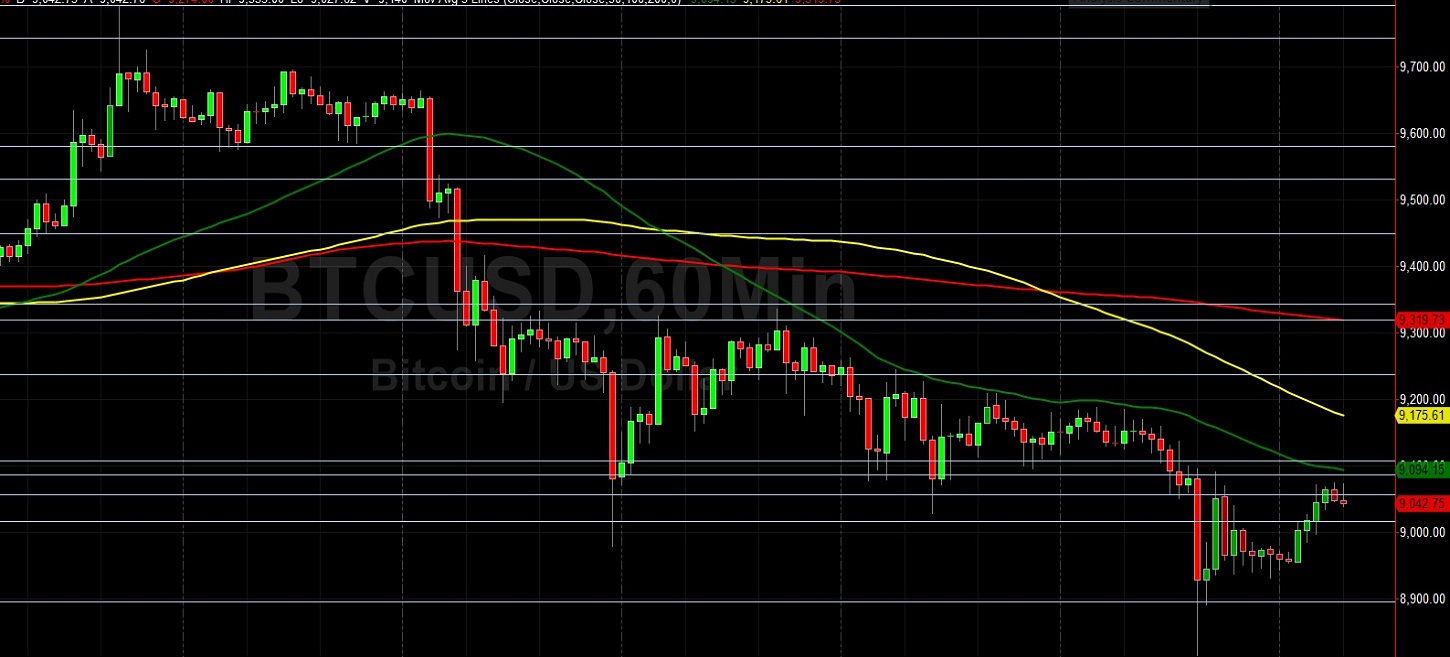
Price activity is nearest the 50-bar MA (4-hourly) at 9310.84 and the 50-bar MA (Hourly) at 9094.15.
Technical Support is expected around 8695.01/ 8540.29/ 8267.50 with Stops expected below.
Technical Resistance is expected around 10428.00/ 10661.23/ 10735.13 with Stops expected above.
On 4-Hourly chart, SlowK is Bullishly above SlowD while MACD is Bearishly below MACDAverage.
On 60-minute chart, SlowK is Bearishly below SlowD while MACD is Bullishly above MACDAverage.