Bitcoin (BTC/USD) moderated early in today’s Asian session as traders contemplated the pair’s recent appreciation that saw it escalate higher to the 9792.00 area, its strongest print since earlier this month. Stops were elected above the 9661.51 area during the ascent, representing the 50% retracement of the recent depreciation from 10428.00 to 8895.01. The next upside retracement levels in this range include the 9842.40 and 10066.21 levels, and traders will be curious to see if these levels will be challenged. Traders are working to determine if market sentiment is likely to improve or weaken from current levels. Traders finally managed to get the pair above the 9530.47, representing the 50% retracement of the recent appreciation from 8632.93 to 10428.00. Below current market activity, Stops were recently elected below the 8993.44 area during the pullback, representing the 61.8% retracement of the appreciation from 8106.70 to 10428, and additional Stops were triggered below the 8910.70 area, an upside price objective related to buying pressure that emerged around the 6456 area in April.
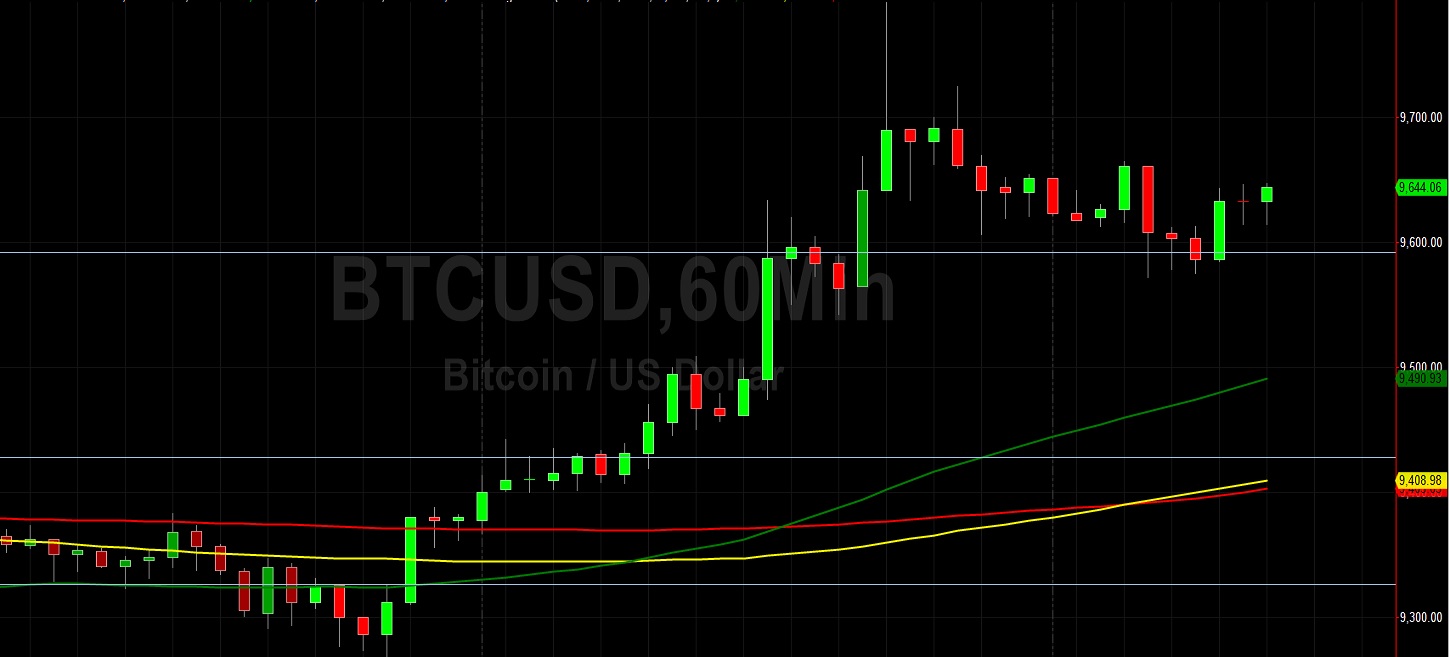
Moreover, Stops were reached below the 9028.89 area, an upside price objective related to buying pressure the originated around the 3858 area. Traders are carefully observing the 8763.44 and 8695.01 levels during additional moves lower. Traders are also paying attention to multiple trading ranges including the recent appreciation from 8106.70 to 9957.25, the appreciation from 6456.00 to 10079.00, the appreciation from 5678.20 to 10079.00, the broader appreciation from 3858.00 to 10079.00, and the appreciation from 8632.93 to 10428.00. Important technical levels related to these ranges include 9530.47, 9318.65, 9040.41, 9025.32, 8808.52, 8695.01, 8610.84, 8540.29, 8398.89, 8267.50, 7878.60, 7839.99, 7702.58, 7359.31, and others. Chartists are observing that the 50-bar MA (4-hourly) is bearishly indicating below the 100-bar MA (4-hourly) and below the 200-bar MA (4-hourly). Also, the 50-bar MA (hourly) is bullishly indicating above the 100-bar MA (hourly) and above the 200-bar MA (hourly).
Price activity is nearest the 100-bar MA (4-hourly) at 9493.91 and the 50-bar MA (Hourly) at 9490.98.
Technical Support is expected around 8695.01/ 8540.29/ 8267.50 with Stops expected below.
Technical Resistance is expected around 10428.00/ 10661.23/ 10735.13 with Stops expected above.
On 4-Hourly chart, SlowK is Bearishly below SlowD while MACD is Bullishly above MACDAverage.
On 60-minute chart, SlowK is Bullishly above SlowD while MACD is Bearishly below MACDAverage.