Bitcoin (BTC/USD) was pressured lower early in today’s Asian session as the pair continued to exhibit weakness below the 9500 figure after peaking around the 9419.35 area during yesterday’s European session. Notably, this level was just below the 23.6% retracement of the recent appreciation from 8895.01 to 9592.04. Technical bids then supported the pair above the 9325.77 level, representing the 38.2% retracement of this appreciating range. Traders recently were able to drive the pair higher to these levels after testing the 9161.00 level, just below the 61.8% retracement of the recent appreciation from 8895.01 to 9592.04. If BTC/USD bears are able to knock the pair lower, traders may be able to test the 9059.51 area, the next downside retracement level in this appreciating range. Traders have been unable to keep the pair above the 9530.47 area during its recent brief trading activity above this level, representing the 50% retracement of the recent appreciation from 8632.93 to 10428.00, and this has been bearish for BTC/USD in the short-term. Another important range that traders are monitoring is the recent depreciation from 10428 to 8895.01, with the 9480.61 and 9256.80 levels representing the 38.2% and 23.6% retracements of this range. Below current market activity, Stops were recently elected below the 8993.44 area during the pullback, representing the 61.8% retracement of the appreciation from 8106.70 to 10428, and additional Stops were triggered below the 8910.70 area, an upside price objective related to buying pressure that emerged around the 6456 area in April.
Moreover, Stops were reached below the 9028.89 area, an upside price objective related to buying pressure the originated around the 3858 area. Traders are carefully observing the 8763.44 and 8695.01 levels during additional moves lower. Traders are working to determine if market sentiment is likely to improve or weaken from current levels. Traders are also paying attention to multiple trading ranges including the recent appreciation from 8106.70 to 9957.25, the appreciation from 6456.00 to 10079.00, the appreciation from 5678.20 to 10079.00, the broader appreciation from 3858.00 to 10079.00, and the appreciation from 8632.93 to 10428.00. Important technical levels related to these ranges include 9530.47, 9318.65, 9040.41, 9025.32, 8808.52, 8695.01, 8610.84, 8540.29, 8398.89, 8267.50, 7878.60, 7839.99, 7702.58, 7359.31, and others. Chartists are observing that the 50-bar MA (4-hourly) is bearishly indicating below the 100-bar MA (4-hourly) and below the 200-bar MA (4-hourly). Also, the 50-bar MA (hourly) is bearishly indicating below the 200-bar MA (hourly) and below the 100-bar MA (hourly).
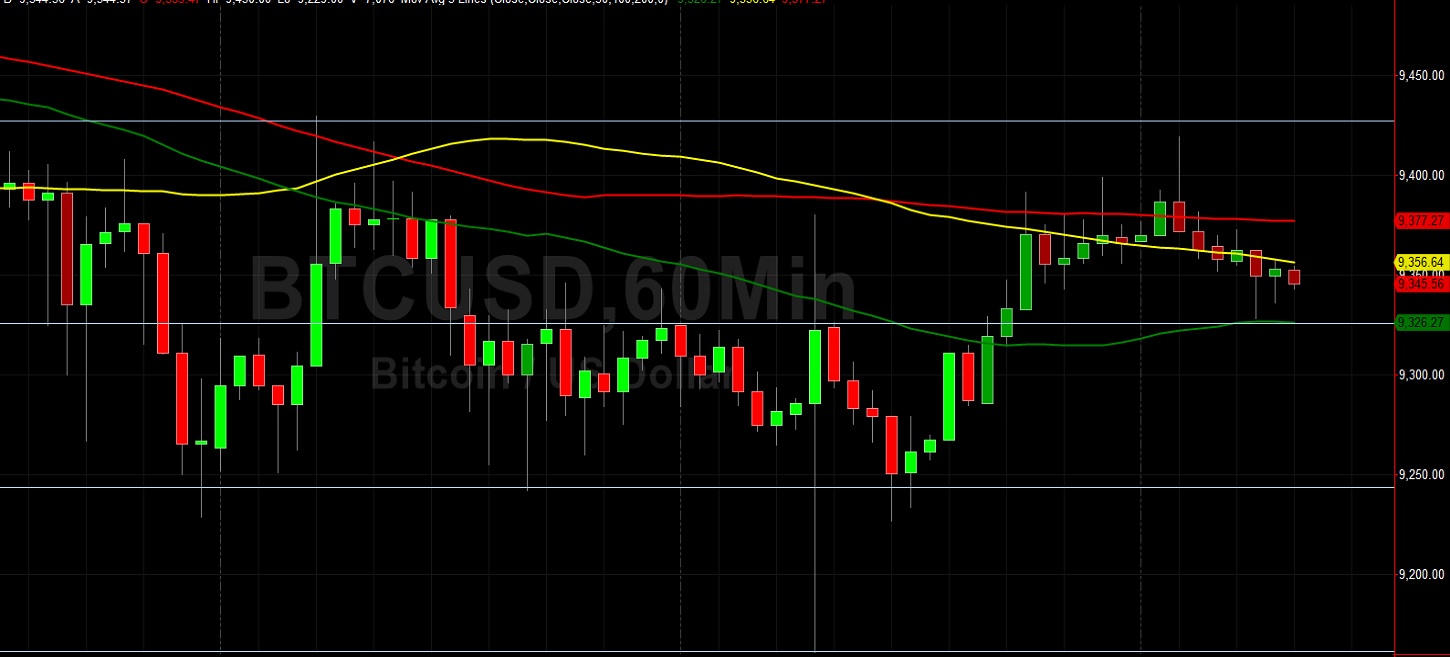
Price activity is nearest the 50-bar MA (4-hourly) at 9376.43 and the 100-bar MA (Hourly) at 9356.62.
Technical Support is expected around 8695.01/ 8540.29/ 8267.50 with Stops expected below.
Technical Resistance is expected around 10428.00/ 10661.23/ 10735.13 with Stops expected above.
On 4-Hourly chart, SlowK is Bearishly below SlowD while MACD is Bullishly above MACDAverage.
On 60-minute chart, SlowK is Bearishly below SlowD while MACD is Bearishly below MACDAverage.