Bitcoin (BTC/USD) failed to sustain recent gains early in today’s Asian session as the pair was trading back below the 9500 level after peaking around the 9694.81 level early in yesterday’s Asian session. Traders lacked the strength to test the 9842.40 area, representing the 61.8% depreciation of the recent depreciating range from 10428.00 to 8895.01. Stops were in turn elected below the 9661.51, 9480.61, and 9256.80 levels, representing the 50%, 38.2%, and 23.6% retracements of the depreciating range. BTC/USD reached the 9195.00 area during yesterday’s North American session, below the 9237.66 area that represents the 61.8% retracement of the recent appreciation from 8895.01 to 9792.00. If selling pressure continues, traders will observe the 9106.70 area as the next downside retracement level in the appreciating range. Below current market activity, Stops were recently elected below the 8993.44 area during the pullback, representing the 61.8% retracement of the appreciation from 8106.70 to 10428, and additional Stops were triggered below the 8910.70 area, an upside price objective related to buying pressure that emerged around the 6456 area in April.
Moreover, Stops were reached below the 9028.89 area, an upside price objective related to buying pressure the originated around the 3858 area. Traders are carefully observing the 8763.44 and 8695.01 levels during additional moves lower. Traders are also paying attention to multiple trading ranges including the recent appreciation from 8106.70 to 9957.25, the appreciation from 6456.00 to 10079.00, the appreciation from 5678.20 to 10079.00, the broader appreciation from 3858.00 to 10079.00, and the appreciation from 8632.93 to 10428.00. Important technical levels related to these ranges include 9530.47, 9318.65, 9040.41, 9025.32, 8808.52, 8695.01, 8610.84, 8540.29, 8398.89, 8267.50, 7878.60, 7839.99, 7702.58, 7359.31, and others. Chartists are observing that the 50-bar MA (4-hourly) is bearishly indicating below the 100-bar MA (4-hourly) and below the 200-bar MA (4-hourly). Also, the 50-bar MA (hourly) is bullishly indicating above the 100-bar MA (hourly) and above the 200-bar MA (hourly).
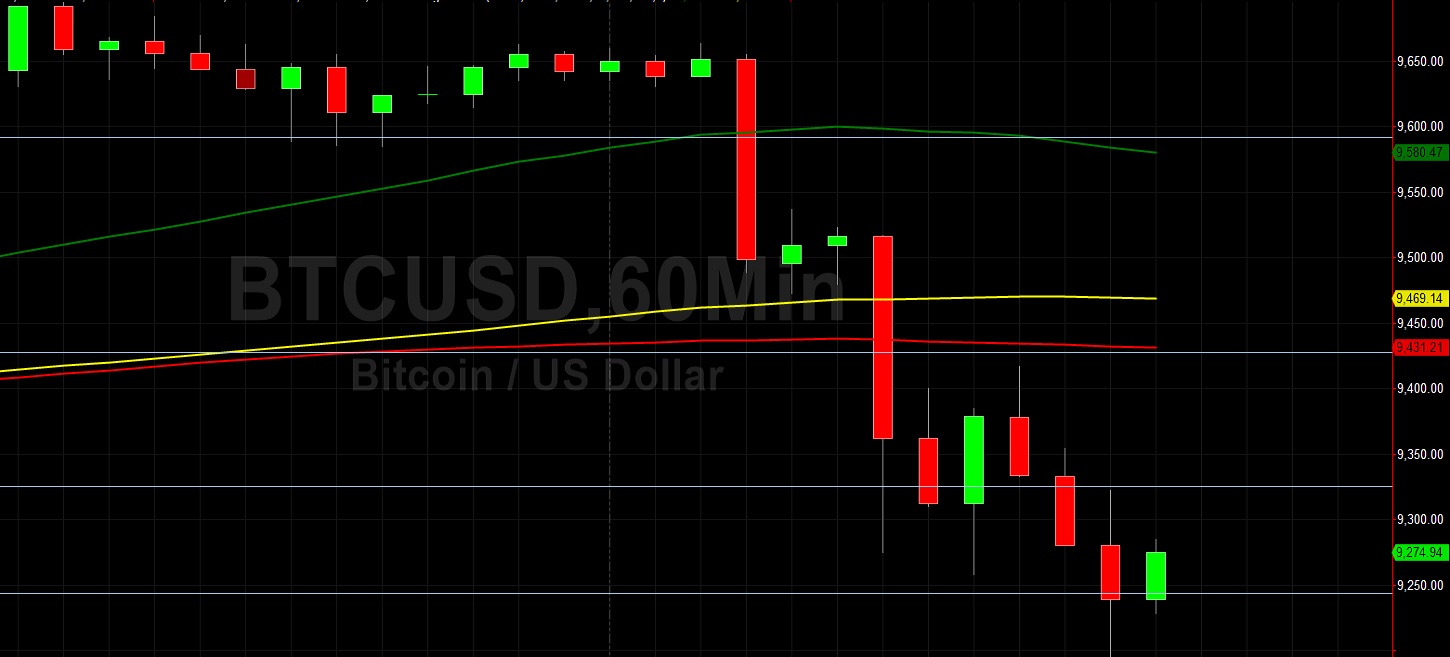
Price activity is nearest the 50-bar MA (4-hourly) at 9422.82 and the 200-bar MA (Hourly) at 9431.21.
Technical Support is expected around 8695.01/ 8540.29/ 8267.50 with Stops expected below.
Technical Resistance is expected around 10428.00/ 10661.23/ 10735.13 with Stops expected above.
On 4-Hourly chart, SlowK is Bearishly below SlowD while MACD is Bearishly below MACDAverage.
On 60-minute chart, SlowK is Bearishly below SlowD while MACD is Bearishly below MACDAverage.