Bitcoin (BTC/USD) experienced a somewhat negative trading bias early in today’s Asian session as the pair continued to trade below the 9200.00 level after encountering selling pressure around the 9335.00 area during yesterday’s Asian session, a bearish signal as this move higher failed to test the 50% retracement of the recent appreciation from 8995.01 to 9792.00. Similarly, this resistance was below the 9385.54 area, representing the 50% retracement of the recent depreciation from 9792.00 to 8979.07. BTC/USD Bears recently knocked the pair lower to the 8979.07 area, and bids subsequently emerged around the 9076.92 area during a move higher. If selling pressure intensifies, longer-term traders are carefully observing the 8877.48 level, an area that represents the 23.6% retracement of the recent appreciation from 3858 to 10428, and decent Stops are likely in place below this level. Traders tested this area on 15 June but lacked the strength to push the market below this level. Stops were recently elected below the 9106.70 and 9086.97 areas during the sharp depreciation, representing the 76.4% and 78.6% retracements of the recent appreciation from 8895.01 to 9792.00. Larger Stops were triggered below the 9056.57 and 9017.07 areas, representing the 76.4% and 78.6% retracements of the broader appreciation from 8632.93 to 10428.00.
Below current market activity, Stops were recently elected below the 8993.44 area during the pullback, representing the 61.8% retracement of the appreciation from 8106.70 to 10428, and additional Stops were triggered below the 8910.70 area, an upside price objective related to buying pressure that emerged around the 6456 area in April. Traders are carefully observing the 8763.44 and 8695.01 levels during additional moves lower. Traders are also paying attention to multiple trading ranges including the recent appreciation from 8106.70 to 9957.25, the appreciation from 6456.00 to 10079.00, the appreciation from 5678.20 to 10079.00, the broader appreciation from 3858.00 to 10079.00, and the appreciation from 8632.93 to 10428.00. Important technical levels related to these ranges include 9530.47, 9318.65, 9040.41, 9025.32, 8808.52, 8695.01, 8610.84, 8540.29, 8398.89, 8267.50, 7878.60, 7839.99, 7702.58, 7359.31, and others. Chartists are observing that the 50-bar MA (4-hourly) is bearishly indicating below the 100-bar MA (4-hourly) and below the 200-bar MA (4-hourly). Also, the 50-bar MA (hourly) is bearishly indicating below the 100-bar MA (hourly) and below the 200-bar MA (hourly).
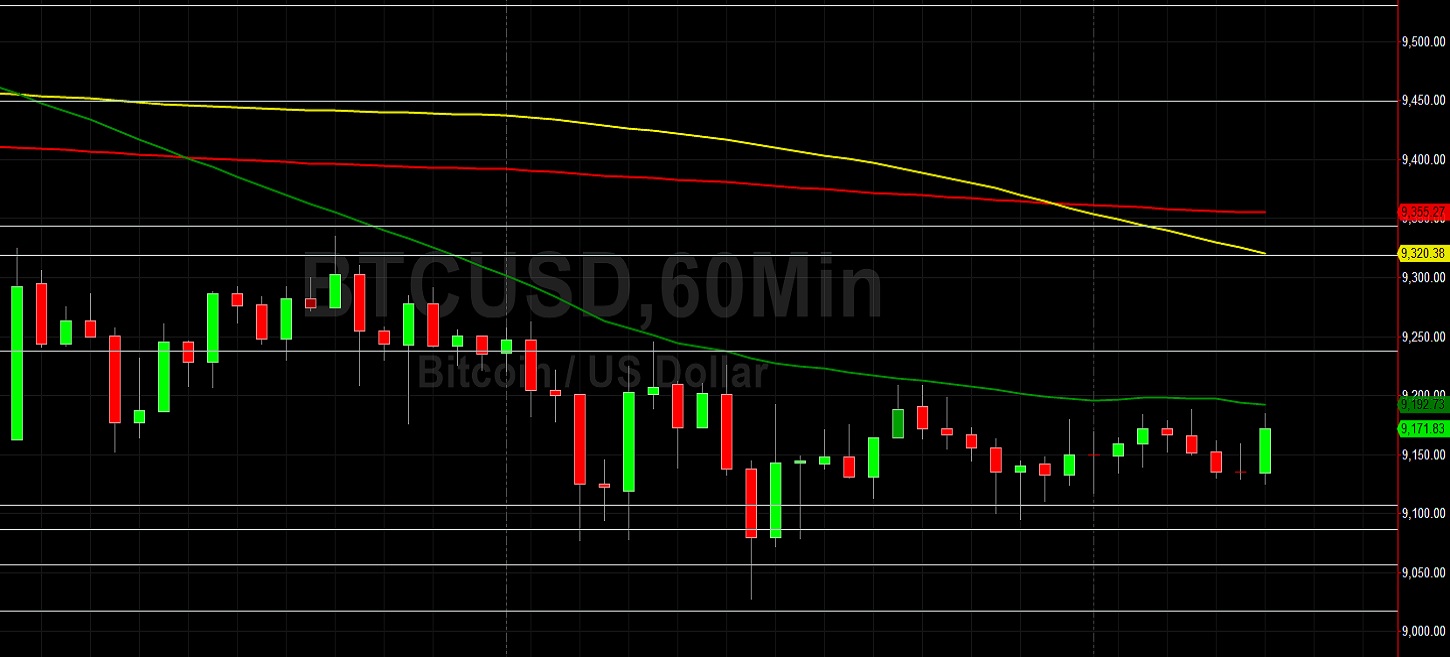
Price activity is nearest the 50-bar MA (4-hourly) at 9348.77 and the 50-bar MA (Hourly) at 9192.58.
Technical Support is expected around 8695.01/ 8540.29/ 8267.50 with Stops expected below.
Technical Resistance is expected around 10428.00/ 10661.23/ 10735.13 with Stops expected above.
On 4-Hourly chart, SlowK is Bullishly above SlowD while MACD is Bearishly below MACDAverage.
On 60-minute chart, SlowK is Bullishly above SlowD while MACD is Bullishly above MACDAverage.