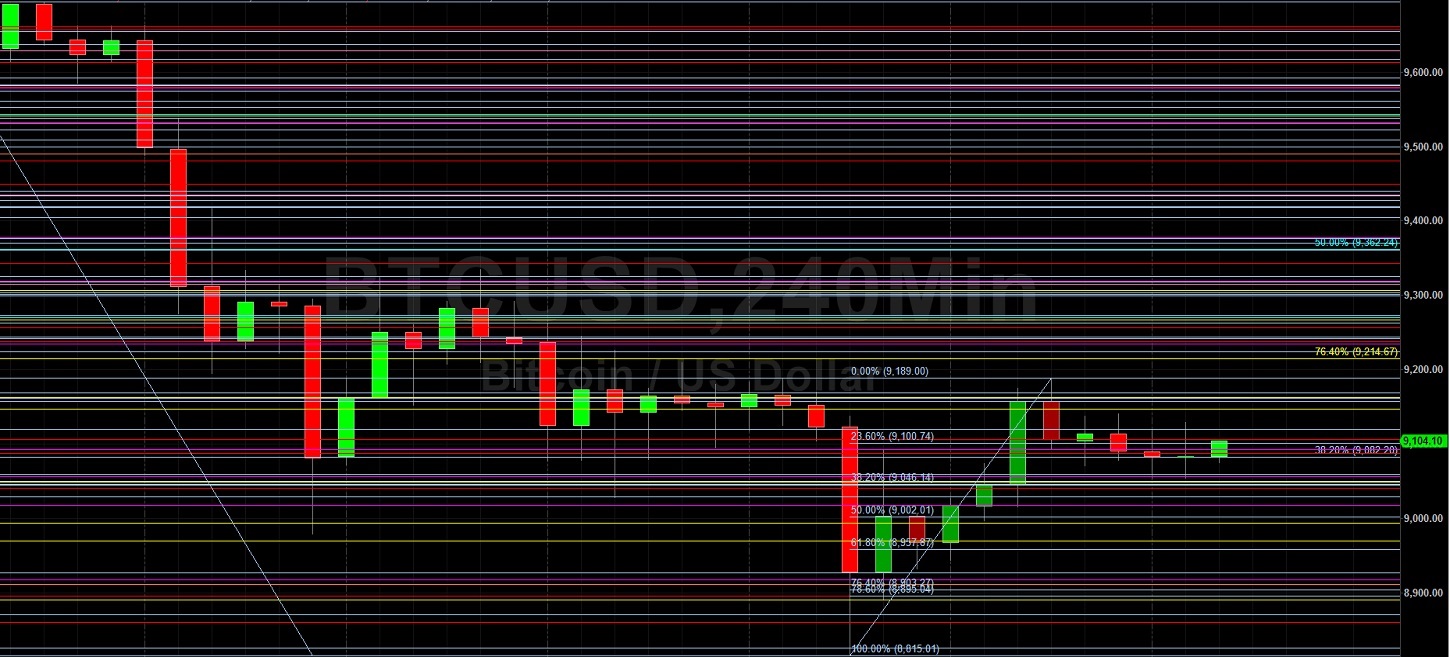
Bitcoin (BTC/USD) remained pressured well below the 9500 level early in today’s Asian session as the pair remains unable to gain much traction above the 9200 area. Technical selling pressure emerged around the 9189.00 area early in yesterday’s Asian session, right around the 38.2% retracement of the recent depreciation from 9792.00 to 8815.01. The 9045.58 area represents the 23.6% retracement of this depreciating range, and traders will observe if BTC/USD will be able to derive any sustainable technical support around this area. Notably, the 8993.44 area is a retracement level that represents the 61.8% retracement of the appreciation from 8106.70 to 10428.00, and the next downside price retracement levels in this appreciating range include the 8654.53 and 8603.46 levels. Larger Stops have recently been absorbed below the 8877.48 area, a level that represents the 23.6% retracement of the recent appreciation from 3858 to 10428. Recently resistance has been below the 9385.54 area, representing the 50% retracement of the recent depreciation from 9792.00 to 8979.07. Relatively large Stops were also triggered below the 9056.57 and 9017.07 areas, representing the 76.4% and 78.6% retracements of the broader appreciation from 8632.93 to 10428.00.
Another important level is the 8910.70 area, and Stops were recently elected below this level, an upside price objective related to buying pressure that emerged around the 6456 area in April. Traders are carefully observing the 8763.44 and 8695.01 levels during additional moves lower. Traders are also paying attention to multiple trading ranges including the recent appreciation from 8106.70 to 9957.25, the appreciation from 6456.00 to 10079.00, the appreciation from 5678.20 to 10079.00, the broader appreciation from 3858.00 to 10079.00, and the appreciation from 8632.93 to 10428.00. Important technical levels related to these ranges include 9530.47, 9318.65, 9040.41, 9025.32, 8808.52, 8695.01, 8610.84, 8540.29, 8398.89, 8267.50, 7878.60, 7839.99, 7702.58, 7359.31, and others. Chartists are observing that the 50-bar MA (4-hourly) is bearishly indicating below the 100-bar MA (4-hourly) and below the 200-bar MA (4-hourly). Also, the 50-bar MA (hourly) is bearishly indicating below the 100-bar MA (hourly) and below the 200-bar MA (hourly).
Price activity is nearest the 50-bar MA (4-hourly) at 9286.03 and the 50-bar MA (Hourly) at 9072.54.
Technical Support is expected around 8695.01/ 8540.29/ 8267.50 with Stops expected below.
Technical Resistance is expected around 9561.43/ 10066.21/ 10428.00 with Stops expected above.
On 4-Hourly chart, SlowK is Bearishly below SlowD while MACD is Bullishly above MACDAverage.
On 60-minute chart, SlowK is Bullishly above SlowD while MACD is Bearishly below MACDAverage.