Ethereum (ETH/USD) erased some recent losses during today’s North American session as the pair climbed higher from the 208.27 level and reached the 214.40 area after Stops were earlier triggered below the 208.76 area, a level that represents the 23.6% retracement of the recent appreciation from 148.08 to 227.50. One short-term level that traders are watching is the 215.15 area, representing the 61.8% retracement of the depreciation from 227.50 to 195.17. Also, the 207.52 area represents the 38.2% retracement of the same depreciating range, and bids have surfaced around this area over the past couple of days. Some Stops are likely in place above the 219.87 area, and traders are curious to see if the market has the strength to retest the recent 227.50 high.
Stops were recently elected around multiple important technical levels, including the 213.05, 206.29, 199.16, and 198.09 levels, and traders will pay close attention to these levels when the market revisits them. Above current price activity, traders will pay very close attention to the 219.87, 232.88 and 242.09 areas, additional upside price objectives related to the 90.00 level, with Stops likely to be decent above the 232.88 area. When ETH/USD comes off, traders will pay close attention to levels including the 187.79, 178.42, and 166.82 levels. Chartists are observing that the 50-bar MA (4-hourly) bullishly continues to bullishly indicate above the 100-bar MA (4-hourly) and 200-bar MA (4-hourly). Also, the 50-bar MA (hourly) is bullishly indicating above the 100-bar MA (hourly) and 200-bar MA (hourly).
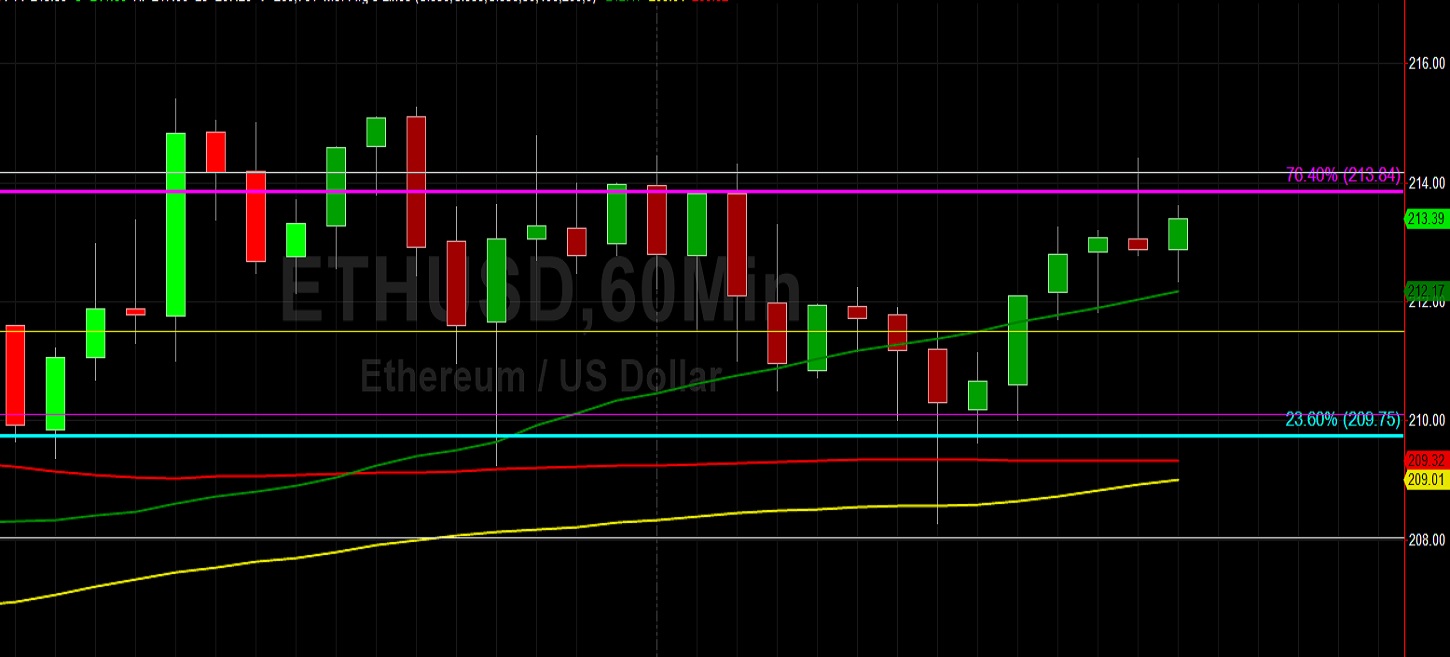
Price activity is nearest the 50-bar MA (4-hourly) at 209.08 and the 50-bar MA (Hourly) at 212.17.
Technical Support is expected around 193.00/ 189.60/ 184.01 with Stops expected below.
Technical Resistance is expected around 227.50/ 232.88/ 242.09 with Stops expected above.
On 4-Hourly chart, SlowK is Bearishly below SlowD while MACD is Bullishly above MACDAverage.
On 60-minute chart, SlowK is Bullishly above SlowD while MACD is Bullishly above MACDAverage.