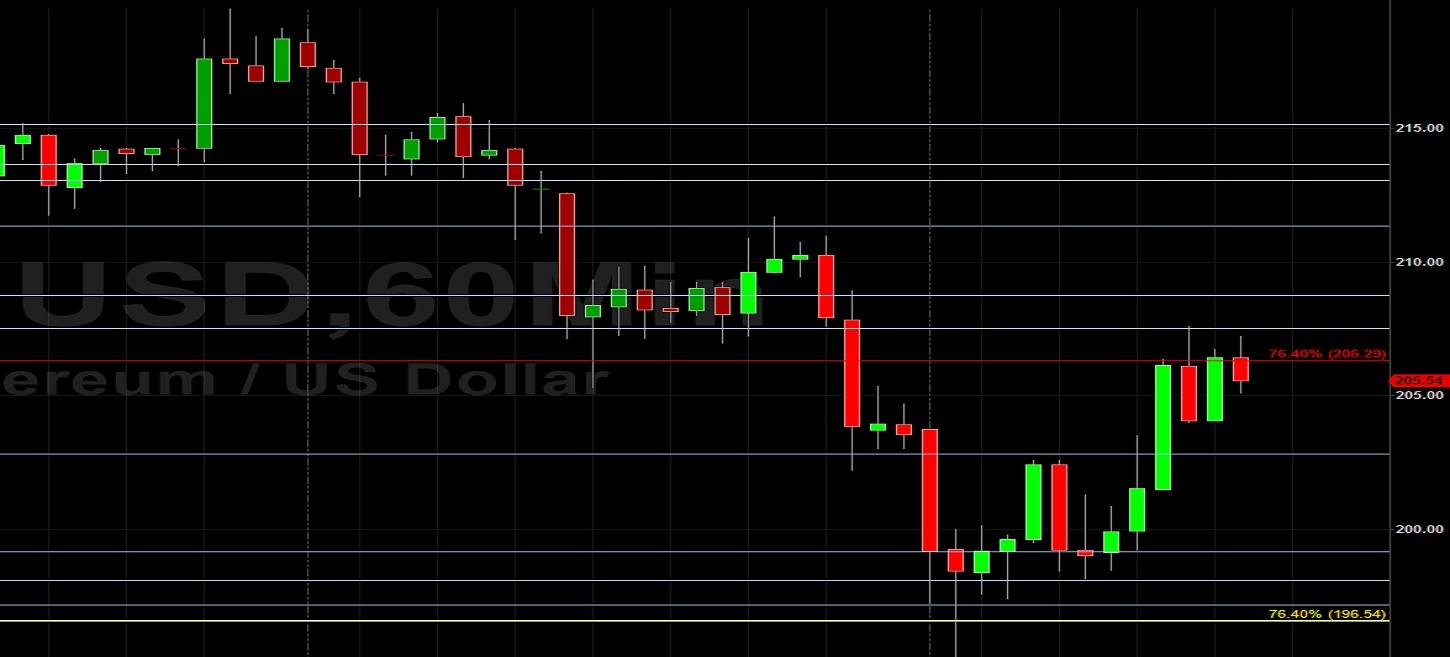
Ethereum (ETH/USD) appreciated during today’s North American session as the pair traded as high as the 207.60 level after trading as low as the 195.17 level during today’s European session. Stops were elected below the 197.16 level during the move lower, a level that represents the 38.2% retracement of the recent appreciation from 148.08 to 227.50. The next technical levels in this range include the 187.79, 178.42, and 166.82 levels and traders will closely monitor them during any additional ETH/USD weakness. Chartists also observed that the market traded as high as the 207.60 level during the pair’s retracement higher, right around the 38.2% retracement of the recent depreciation from 227.50 to 195.17. These trading patterns highlight the current technical nature of the price activity of ETH/USD following the recent relative high around the 227.50 level.
Stops were elected last week around multiple important technical levels, including the 213.05, 206.29, 199.16, and 198.09 levels. Above current price activity, traders will pay very close attention to the 232.88 and 242.09 areas, additional upside price objectives related to the 90.00 level, with Stops likely to be decent above the 232.88 area. When ETH/USD comes off, traders will pay close attention to levels including the 187.79, 178.42, and 166.82 levels. Chartists are observing that the 50-bar MA (4-hourly) bullishly continues to indicate above the 100-bar MA (4-hourly) and 200-bar MA (4-hourly). Also, the 50-bar MA (hourly) bearishly crossed below the 100-bar MA (hourly), and continues to indicate above the 200-bar MA (hourly).
Price activity is nearest the 50-bar MA (4-hourly) at 206.06 and the 200-bar MA (Hourly) at 205.94.
Technical Support is expected around 193.00/ 189.60/ 184.01 with Stops expected below.
Technical Resistance is expected around 227.50/ 232.88/ 242.09 with Stops expected above.
On 4-Hourly chart, SlowK is Bullishly above SlowD while MACD is Bearishly below MACDAverage.
On 60-minute chart, SlowK is Bullishly above SlowD while MACD is Bullishly above MACDAverage.