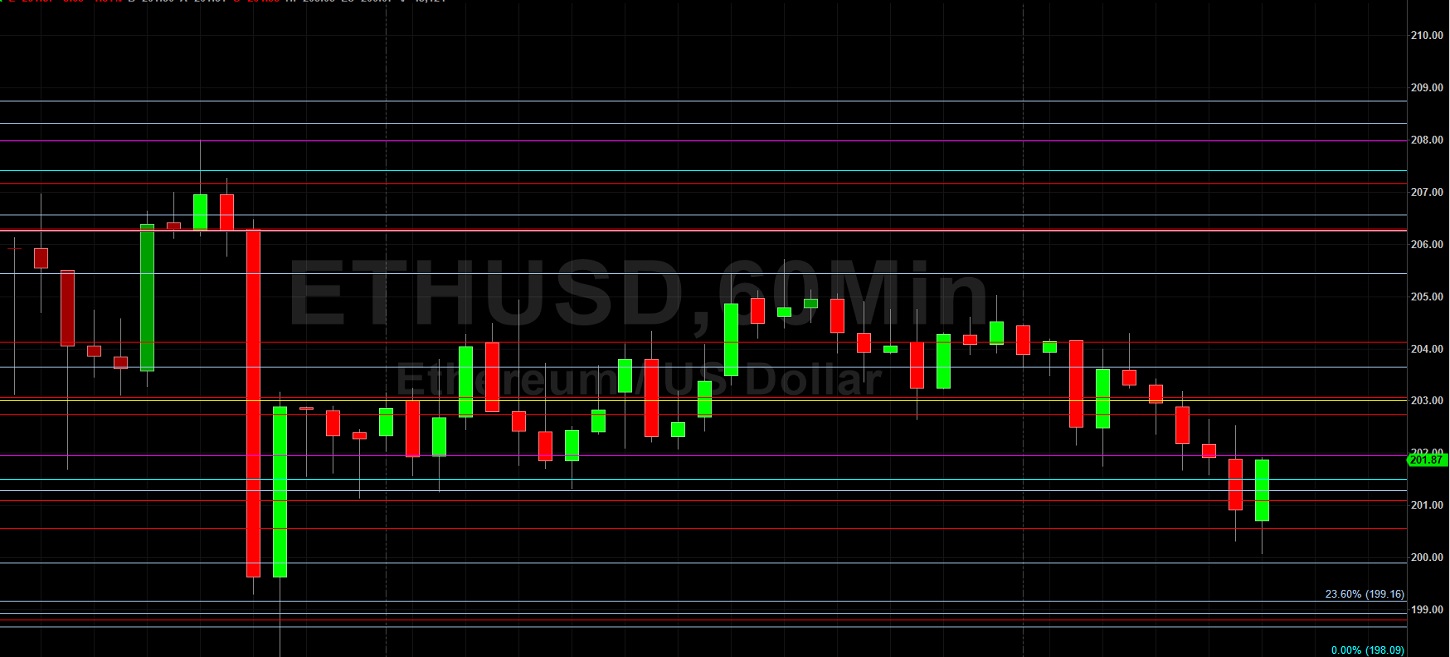
Ethereum (ETH/USD) reversed some recent weakness during today’s North American session as the pair depreciated to the 200.07 area after trading as high as the 205.71 level early in today’s Asian session, just above the 205.44 area that represents a downside price objective related to selling pressure that originated around the 214.40 area earlier this month. The 199.90 area represents another downside price objective related to selling pressure that emerged around the 214.40 area, and was supportive of ETH/USD during the move lower today. Traders continue to monitor multiple trading ranges, including the recent appreciation from 176.43 to 216.99. The 201.50 and 196.71 areas represent the 38.2% and 50% retracements of this range, and ETH/USD bulls are looking to see if the market is able to derive some technical support from these levels. Additional appreciating ranges that are technically significant include the move from 148.08 to 227.50, the move from 123.72 to 227.50, and the appreciation from 90.00 to 227.50.
Important technical levels related to those ranges include the 208.76, 203.01, 197.16, 195.10, 187.79, and 175.02 levels, and traders are very interested to observe how price activity reacts around these levels. Below current market activity, traders continue to monitor the 196.56 and 177.39 levels as downside price targets, both of which relate to selling pressure that emerged around the 253.01 area in early March. Additional downside areas of potential technical support include the 190.93, 186.00, 185.39, and 185.11 areas. Chartists are observing that the 50-bar MA (4-hourly) is bullishly indicating above the 100-bar MA (4-hourly) and above the 200-bar MA (4-hourly). Also, the 50-bar MA (hourly) is bearishly indicating below the 200-bar MA (hourly) and above the 100-bar MA (hourly).
Price activity is nearest the 100-bar MA (4-hourly) at 201.66 and the 50-bar MA (Hourly) at 203.65.
Technical Support is expected around 191.27/ 185.39/ 177.39 with Stops expected below.
Technical Resistance is expected around 215.09/ 219.48 / 227.50 with Stops expected above.
On 4-Hourly chart, SlowK is Bearishly below SlowD while MACD is Bearishly below MACDAverage.
On 60-minute chart, SlowK is Bullishly above SlowD while MACD is Bearishly below MACDAverage.