Bitcoin (BTC/USD) gave back some earlier gains during today’s Asian session as the pair fell to the 9129.40 area after peaking around the 9267.34 area during yesterday’s North American session. Stops were elected above the 9060.07 and 9208.54 levels during the move higher, representing the 23.6% and 38.2% retracements of the recent depreciation from 9836.99 to 8820.08. Additional Stops were reached above the 9242.11 area during the move higher, representing the 38.2% retracement of the appreciation from 8106.70 to 9943.93. If the pair is able to resume its upward trajectory, traders will pay close attention to levels including the 9328.54, 9448.53, and 9597.00 levels. During the pair’s recent move lower, additional Stops were reached below the 9092.85 and 8860.12 levels, representing the 50% and 38.2% retracements of the recent depreciation from 10079 to 8106.70.
Some traders believe the pair may have additional downside room to run, with the 8715.54 area emerging as an additional downside target. Some areas of potential technical support to the downside include the 8695.01, 8267.50, and 7839.99 areas, levels that represent the 38.2%, 50%, and 61.8% retracements of the appreciation from 6456.00 to 10079.00. Traders are also closely monitoring additional downside areas of potential technical support around the 8572.16, 8540.29, and 8499.87 areas, with additional focus on the 7967.33, 7610.66, 7423.22, and 7169.35 levels. Chartists are observing that the 50-bar MA (4-hourly) continues to bullishly indicate above the 100-bar MA (4-hourly) and 200-bar MA (4-hourly). Also, the 50-bar MA (hourly) is bearishly indicating below the 100-bar MA (hourly) and 200-bar MA (hourly).
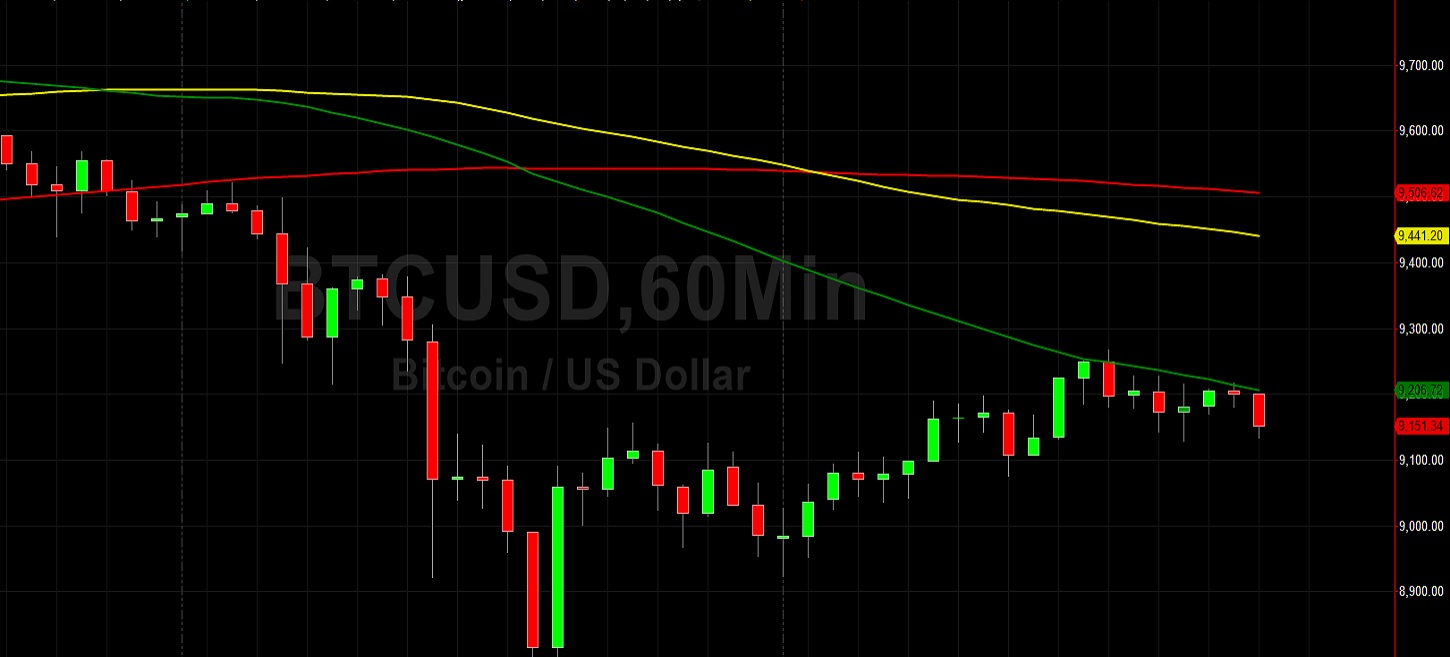
Price activity is nearest the 100-bar MA (4-hourly) at 9366.45 and the 50-bar MA (Hourly) at 9206.71.
Technical Support is expected around 8695.01/ 8540.29/ 8267.50 with Stops expected below.
Technical Resistance is expected around 10079.00/ 10316.39/ 10661.23 with Stops expected above.
On 4-Hourly chart, SlowK is Bullishly above SlowD while MACD is Bearishly below MACDAverage.
On 60-minute chart, SlowK is Bearishly below SlowD while MACD is Bullishly above MACDAverage.