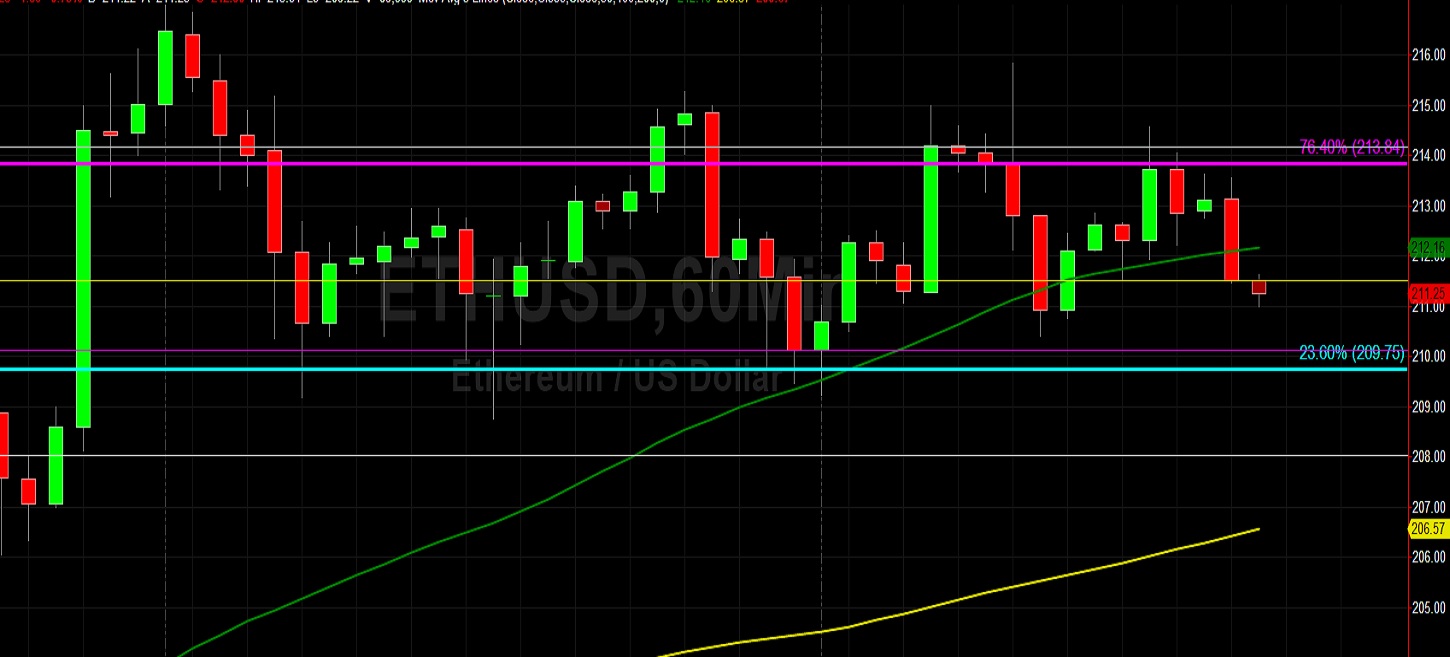
Ethereum (ETH/USD) extended some of its recent sideways trading activity during today’s North American session as traders were able to keep the pair bid above the psychologically-important 200.00 figure after the pair traded as high as the 215.84 level during today’s European session. That level was just above the 215.48 area that represents the 76.4% retracement of the recent depreciation from 227.54 to 176.43. The market has derived some intraday technical support around the 210.69 area, representing the 23.6% retracement of the depreciating range. Bullish sentiment remains ongoing following the pair’s improvement from the 90.00 level in March, with Stops recently elected above the 214.40, 215.48, and 216.61 levels. Stops were also recently elected above the 202.73, 205.44, 207.43, and 208.76 areas.
Some important technical areas below the market include the 197.16 and 187.79 levels, representing the 38.2% and 50% retracements of the recent appreciation from the 148.08 area to the 227.50 level. Additionally, the 187.86 area also represents the 38.2% retracement of the wider appreciation from 123.72 to 227.50 and large Stops were also recently reached below the 195.05 area, representing the 23.6% retracement of the wider appreciation from 90.00 to 227.50. Additional downside price objectives related to this selling pressure include the 176.23 and 171.99 areas, and traders will be curious to see what kind of technical support emerges around these levels when the market comes off further. Additional downside areas that traders will be monitoring include the 178.42 and 166.82 levels. Chartists are observing that the 50-bar MA (4-hourly) is bearishly indicating below the 100-bar MA (4-hourly) and above the 200-bar MA (4-hourly). Also, the 50-bar MA (hourly) is bullishly indicating above the 100-bar MA (hourly) and 200-bar MA (hourly).
Price activity is nearest the 100-bar MA (4-hourly) at 202.60 and the 50-bar MA (Hourly) at 212.16.
Technical Support is expected around 191.93/ 185.39/ 177.39 with Stops expected below.
Technical Resistance is expected around 227.50/ 232.88/ 242.09 with Stops expected above.
On 4-Hourly chart, SlowK is Bearishly below SlowD while MACD is Bearishly below MACDAverage.
On 60-minute chart, SlowK is Bearishly below SlowD while MACD is Bearishly below MACDAverage.