Ethereum (ETH/USD) traded sideways during today’s North American session as the pair continued to trade around the 208.00 level after trading as low as the 205.28 area early in the North American session. Some Stops were elected below the 206.29 area during the move lower, an area that represents a downside price objective related to selling pressure that emerged around the 253.01 area in early March. During today’s Asian session, the pair traded as high as the 219.48 level after Stops were elected above the 217.87 area, a level that represents the 61.8% retracement of the depreciation from 227.50 to 202.30. The 208.25 level represents the 23.6% retracement of this range, and chartist are curious to see if this level becomes technical resistance for ETH/USD. These trading patterns underscore the current technical nature of the price activity of ETH/USD following the recent relative high around the 227.50 level.
Stops were elected last week around multiple important technical levels, including the 213.05, 206.29, 199.16, and 198.09 levels. Above current price activity, traders will pay very close attention to the 232.88 and 242.09 areas, additional upside price objectives related to the 90.00 level, with Stops likely to be decent above the 232.88 area. When ETH/USD comes off, traders will pay close attention to levels including the 197.16, 187.79, 178.42, and 166.82 levels. Chartists are observing that the 50-bar MA (4-hourly) bullishly continues to indicate above the 100-bar MA (4-hourly) and 200-bar MA (4-hourly). Also, the 50-bar MA (hourly) bearishly crossed below the 100-bar MA (hourly), and continues to indicate above the 200-bar MA (hourly).
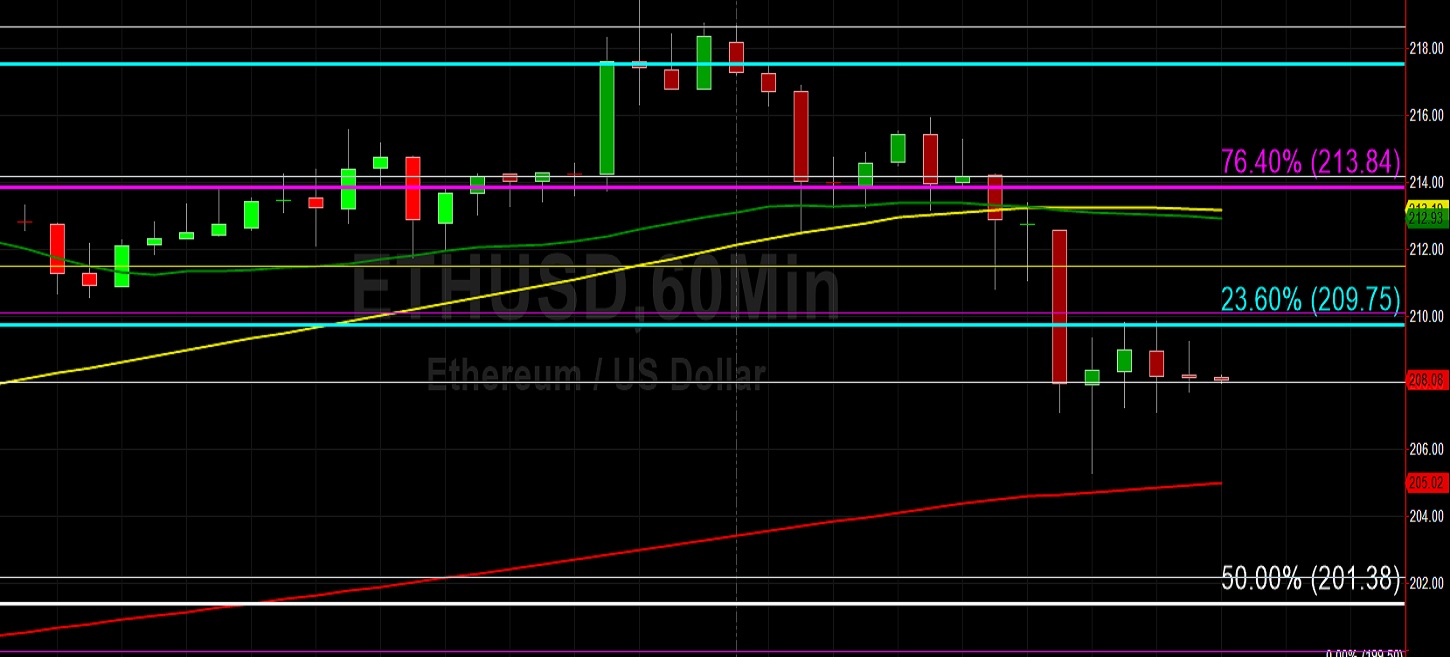
Price activity is nearest the 50-bar MA (4-hourly) at 202.37 and the 50-bar MA (Hourly) at 211.57.
Technical Support is expected around 199.27/ 196.54/ 193.00 with Stops expected below.
Technical Resistance is expected around 227.50/ 232.88/ 242.09 with Stops expected above.
On 4-Hourly chart, SlowK is Bearishly below SlowD while MACD is Bearishly below MACDAverage.
On 60-minute chart, SlowK is Bearishly below SlowD while MACD is Bearishly below MACDAverage.