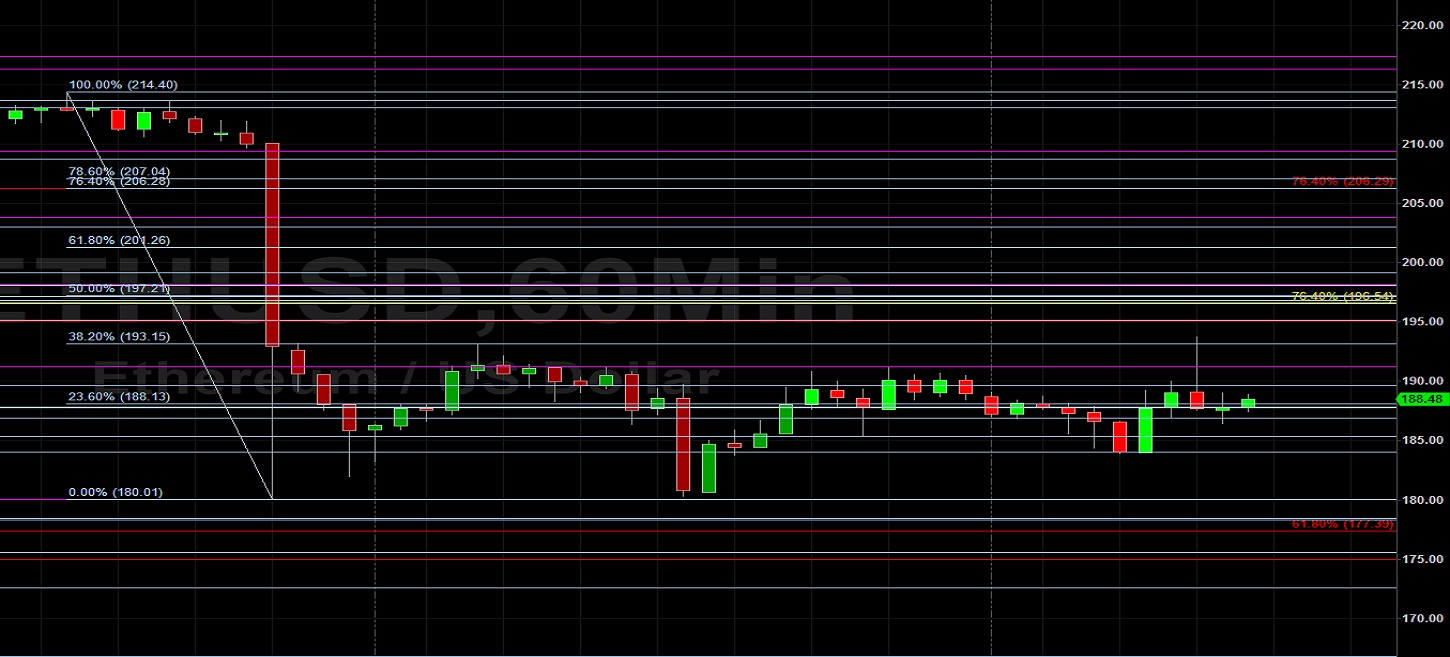
Ethereum (ETH/USD) extended its sideways trading pattern during today’s North American session as the pair climbed to the 193.77 area, above the 191.23 area that represents the 23.6% retracement of the recent depreciation from 227.54 to 180.01. Notably, this intraday high was just above the 193.15 area that represents the 38.2% retracement of the recent depreciation from 214.40 to 180.01. The next upside retracement levels in this range include the 197.21, 201.26, and 206.28 areas. During a pullback in today’s European session, the pair was supported around the 183.89 area, right around an upside price objective related to buying pressure that originated around the 90.00 area in March. During last weekend, ETH/USD traded as low as the 180.33 level one day after the pair dramatically fell from the 214.44 area to the 180.01 area in very short order. Stops were triggered below the 197.16 and 187.79 levels, representing the 38.2% and 50% retracements of the recent appreciation from the 148.08 area to the 227.50 level. The 187.86 area also represents the 38.2% retracement of the wider appreciation from 123.72 to 227.50 and large Stops were also reached below the 195.05 area, representing the 23.6% retracement of the wider appreciation from 90.00 to 227.50.
Additional downside price objectives related to this selling pressure include the 176.23 and 171.99 areas, and traders will be curious to see what kind of technical support emerges around these levels when the market comes off further. Following ETH/USD’s move lower, traders will be curious to see what happens around upside price objectives related to buying pressure that emerged around the 90.00 level, including the 198.09, 199.16, 206.29, and 213.05 areas. Additional downside areas that traders will be monitoring include the 178.42 and 166.82 levels. Chartists are observing that the 50-bar MA (4-hourly) has bearishly converged with the 100-bar MA (4-hourly), and continues to indicate above the 200-bar MA (4-hourly). Also, the 50-bar MA (hourly) has bearishly moved below the 100-bar MA (hourly) and 200-bar MA (hourly).
Price activity is nearest the 200-bar MA (4-hourly) at 186.94 and the 50-bar MA (Hourly) at 193.39.
Technical Support is expected around 177.39/ 166.82/ 161.62 with Stops expected below.
Technical Resistance is expected around 196.54/ 206.29/ 215.19 with Stops expected above.
On 4-Hourly chart, SlowK is Bearishly below SlowD while MACD is Bearishly below MACDAverage.
On 60-minute chart, SlowK is Bearishly below SlowD while MACD is Bullishly above MACDAverage.