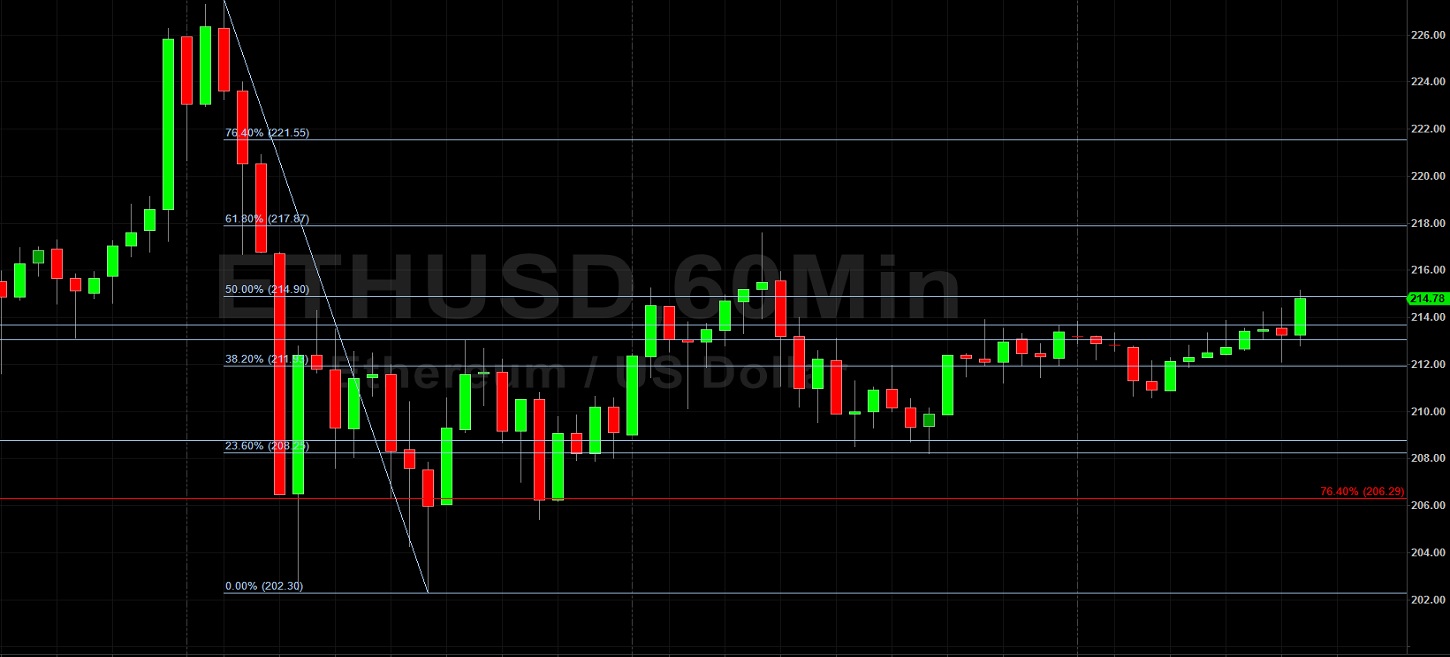
Ethereum (ETH/USD) appreciated steadily during today’s North American session as the pair gained ground to the 214.40 level after buying pressure originated around the 208.20 level during today’s Asian session. The 214.90 area remains an important technical level that the pair may test in the short-term, representing the 50% retracement of the recent depreciation from 227.50 to 202.30. The 217.87 level is the 61.8% retracement of this same depreciating range, and it served as technical resistance late last week as the market then declined to test the 23.6% retracement level of the same range. These trading patterns underscore the current technical nature of the price activity of ETH/USD following the recent relative high around the 227.50 level.
Stops were elected this week around multiple important technical levels, including the 213.05, 206.29, 199.16, and 198.09 levels. Above current price activity, traders will pay very close attention to the 232.88 and 242.09 areas, additional upside price objectives related to the 90.00 level, with Stops likely to be decent above the 232.88 area. When ETH/USD comes off, traders will pay close attention to levels including the 197.16, 187.79, 178.42, and 166.82 levels. Chartists are observing that the 50-bar MA (4-hourly) bullishly continues to indicate above the 100-bar MA (4-hourly) and 200-bar MA (4-hourly). Also, the 50-bar MA (hourly) continues to indicate above the 100-bar MA (hourly), and continues to indicate above the 200-bar MA (hourly).
Price activity is nearest the 50-bar MA (4-hourly) at 202.37 and the 50-bar MA (Hourly) at 211.57.
Technical Support is expected around 199.27/ 196.54/ 193.00 with Stops expected below.
Technical Resistance is expected around 227.50/ 232.88/ 242.09 with Stops expected above.
On 4-Hourly chart, SlowK is Bullishly above SlowD while MACD is Bearishly below MACDAverage.
On 60-minute chart, SlowK is Bullishly above SlowD while MACD is Bullishly above MACDAverage.