Ethereum (ETH/USD) continued to add to its ongoing bullish sentiment during today’s North American session as traders continue to manage market risk above the psychologically-important 200.00 figure. Traders lifted the pair to the 216.99 area during today’s European session before it came off, essentially around the same 217.00 resistance area the pair encountered earlier in May. Bullish sentiment remains ongoing following the pair’s improvement from the 90.00 level in March. During the climb higher, Stops were elected above the 214.40, 215.48, and 216.61 levels. Stops were also recently elected above the 202.73 level during the ascent higher, an upside price objective that represents the 76.4% retracement of the depreciation from 206.25 to 191.35. Additional Stops were triggered above the 205.44 area, representing the 76.4% retracement of the recent depreciation from 214.40 to 176.43, followed by Stops that were elected above the 207.43 area, representing the 76.4% retracement of the depreciation from 217.00 to 176.43. Also, Stops were elected above the 208.76 area, an upside price objective related to buying pressure that emerged around the 148.08 area in April. Below current market activity, traders continue to monitor the 191.93 area, representing the 38.2% retracement of the same depreciating range.
Earlier this month, Stops were triggered below the 197.16 and 187.79 levels, representing the 38.2% and 50% retracements of the recent appreciation from the 148.08 area to the 227.50 level. Additionally, the 187.86 area also represents the 38.2% retracement of the wider appreciation from 123.72 to 227.50 and large Stops were also recently reached below the 195.05 area, representing the 23.6% retracement of the wider appreciation from 90.00 to 227.50. Additional downside price objectives related to this selling pressure include the 176.23 and 171.99 areas, and traders will be curious to see what kind of technical support emerges around these levels when the market comes off further. Additional downside areas that traders will be monitoring include the 178.42 and 166.82 levels. Chartists are observing that the 50-bar MA (4-hourly) is bearishly indicating below the 100-bar MA (4-hourly) and above the 200-bar MA (4-hourly). Also, the 50-bar MA (hourly) is bullishly indicating above the 100-bar MA (hourly) and 200-bar MA (hourly).
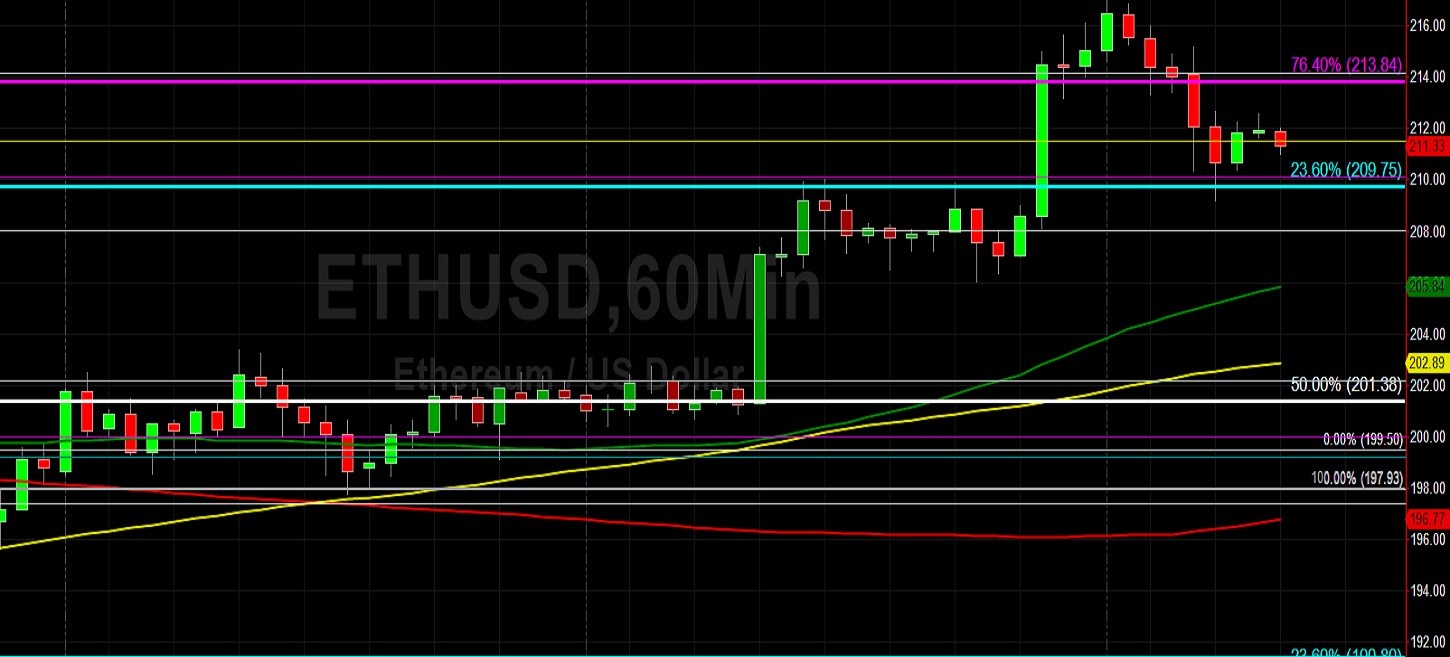
Price activity is nearest the 100-bar MA (4-hourly) at 202.73 and the 50-bar MA (Hourly) at 205.85.
Technical Support is expected around 191.93/ 185.39/ 177.39 with Stops expected below.
Technical Resistance is expected around 227.50/ 232.88/ 242.09 with Stops expected above.
On 4-Hourly chart, SlowK is Bearishly below SlowD while MACD is Bullishly above MACDAverage.
On 60-minute chart, SlowK is Bullishly above SlowD while MACD is Bearishly below MACDAverage.