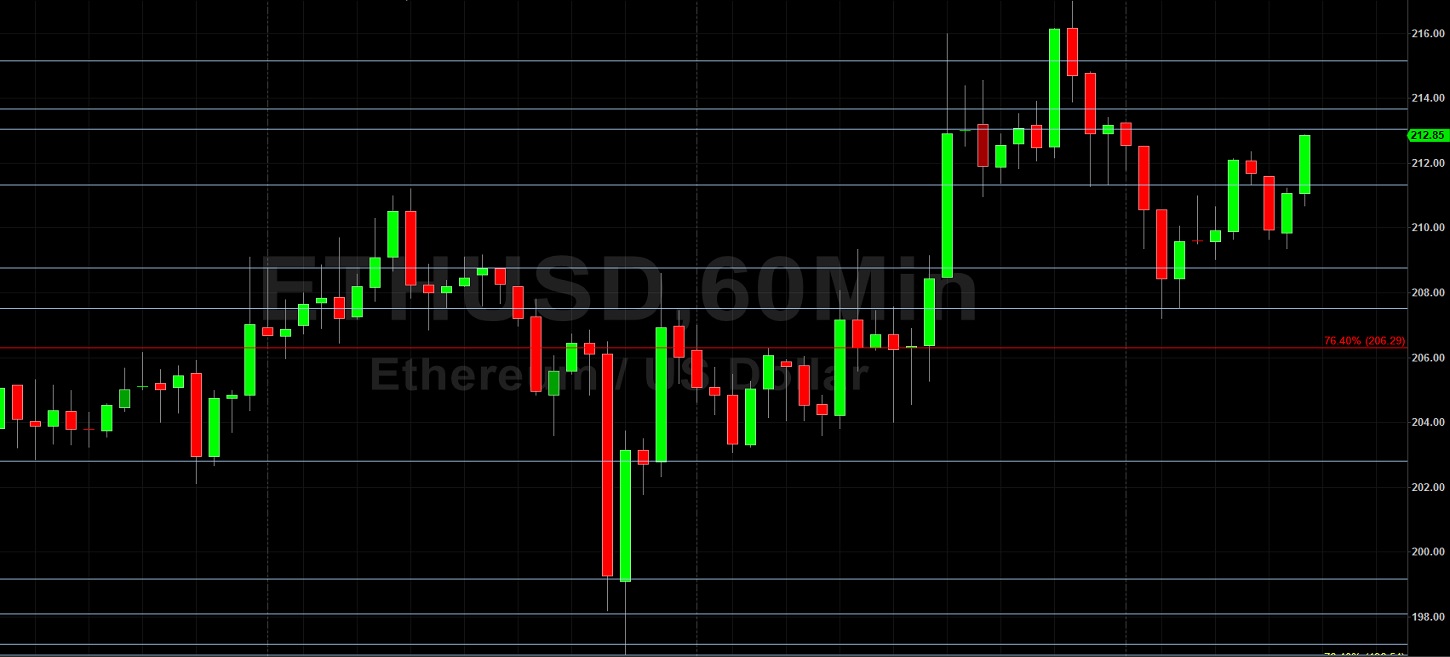
Ethereum (ETH/USD) consolidated some earlier gains during today’s North American session as the pair fell back to the 211.83 level after trading as high as the 217.00 area during today’s North American session. Stops were elected above the 215.15 level during the climb to multi-day highs, a level that represents the 61.8% retracement of the recent depreciation from 227.50 to 195.17. During the pair’s subsequent pullback, technical buying pressure emerged around the 207.52 area, representing the 38.2% retracement of the depreciating range. If the pair is able to resume its upward trajectory, traders will pay close attention to the 219.87 area, a level that represents the 76.4% retracement of the recent depreciating range.
Stops were elected last week around multiple important technical levels, including the 213.05, 206.29, 199.16, and 198.09 levels, and traders will pay close attention to these levels when the market revisits them. Above current price activity, traders will pay very close attention to the 215.15, 219.87, 232.88 and 242.09 areas, additional upside price objectives related to the 90.00 level, with Stops likely to be decent above the 232.88 area. When ETH/USD comes off, traders will pay close attention to levels including the 187.79, 178.42, and 166.82 levels. Chartists are observing that the 50-bar MA (4-hourly) bullishly continues to indicate above the 100-bar MA (4-hourly) and 200-bar MA (4-hourly). Also, the 200-bar MA (hourly) is bearishly indicating above the 50-bar MA (hourly) and 100-bar MA (hourly).
Price activity is nearest the 50-bar MA (4-hourly) at 208.88 and the 200-bar MA (Hourly) at 209.10.
Technical Support is expected around 193.00/ 189.60/ 184.01 with Stops expected below.
Technical Resistance is expected around 227.50/ 232.88/ 242.09 with Stops expected above.
On 4-Hourly chart, SlowK is Bearishly below SlowD while MACD is Bullishly above MACDAverage.
On 60-minute chart, SlowK is Bullishly above SlowD while MACD is Bearishly below MACDAverage.