Bitcoin (BTC/USD) gave back some recent gains early in today’s Asian session as the pair came off to the 9330.01 level after trading as high as the 9625.00 area during yesterday’s Asian session, its strongest level in more than one week and right around a downside price objective related to selling pressure that originated around the 9836.99 area this month. Similarly, the bids that emerged around the 9330 area during yesterday’s North American session were just above the 9328.54 area, representing a related downside price objective. During the recent move higher, Stops were reached above the 8890.13, 8969.58, 9049.03, and 9147.33 areas, representing the 38.2%, 50%, 61.8%, and 76.4% retracements of the recent depreciation from 9306.23 to 8632.93. Traders have also recently triggered Stops above the 9318.50 level, right around the 50% retracement of the recent depreciation from 9836.99 to 8800.00.
Additional important price retracement levels that traders are monitoring include the 9440.86 and 9592.26 levels. Traders are also paying attention to multiple trading ranges including the recent appreciation from 8106.70 to 9957.25, the appreciation from 6456.00 to 10079.00, the appreciation from 5678.20 to 10079.00, and the broader appreciation from 3858.00 to 10079.00. Important technical levels related to these ranges include 9040.41, 9025.32, 8808.52, 8695.01, 8610.84, 8540.29, 8398.89, 8267.50, 7878.60, 7839.99, 7702.58, 7359.31, and others. Chartists are observing that the 50-bar MA (4-hourly) is bullishly indicating below the 100-bar MA (4-hourly) and above the 200-bar MA (4-hourly). Also, the 50-bar MA (hourly) is bullishly indicating above the 100-bar MA (hourly) and above the 200-bar MA (hourly).
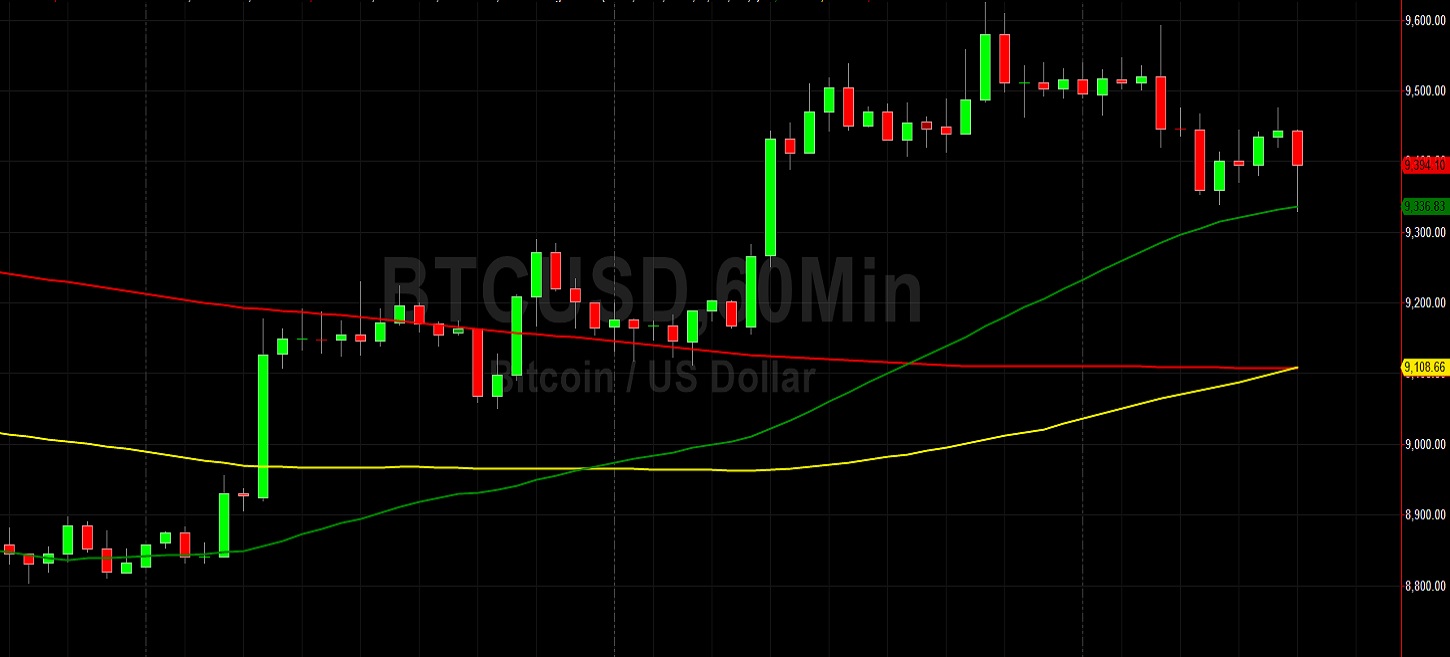
Price activity is nearest the 200-bar MA (4-hourly) at 9315.23 and the 50-bar MA (Hourly) at 9336.68.
Technical Support is expected around 8695.01/ 8540.29/ 8267.50 with Stops expected below.
Technical Resistance is expected around 10079.00/ 10316.39/ 10661.23 with Stops expected above.
On 4-Hourly chart, SlowK is Bearishly below SlowD while MACD is Bullishly above MACDAverage.
On 60-minute chart, SlowK is Bullishly above SlowD while MACD is Bearishly below MACDAverage.