Bitcoin (BTC/USD) attempted to extend its recent upward momentum during today’s Asian session as the pair continued to trade above the 9000 figure after bids emerged around the 8800 area during yesterday’s Asian session. Some minor Stops have recently been elected above the 9196.13 area, representing the 38.2% retracement of the recent depreciation from 9836.99 to 8800.00. Buying pressure also emerged around the 9044.73 area, representing the 23.6% retracement of the depreciating range. Additional upside price retracement levels that traders are monitoring include the 9440.86 and 9592.26 levels. The recent depreciation was quite technical in nature, as the 8820.08 area represented a downside price objective and BTC/USD bears were only able to take the pair as low as the 8800.00 level.
Traders are also paying attention to multiple trading ranges including the recent appreciation from 8106.70 to 9957.25, the appreciation from 6456.00 to 10079.00, the appreciation from 5678.20 to 10079.00, and the broader appreciation from 3858.00 to 10079.00. Important technical levels related to these ranges include 9040.41, 9025.32, 8808.52, 8695.01, 8610.84, 8540.29, 8398.89, 8267.50, 7878.60, 7839.99, 7702.58, 7359.31, and others. Chartists are observing that the 50-bar MA (4-hourly) continues to bullishly indicate above the 100-bar MA (4-hourly) and 200-bar MA (4-hourly). Also, the 50-bar MA (hourly) is bearishly indicating below the 100-bar MA (hourly) and 200-bar MA (hourly).
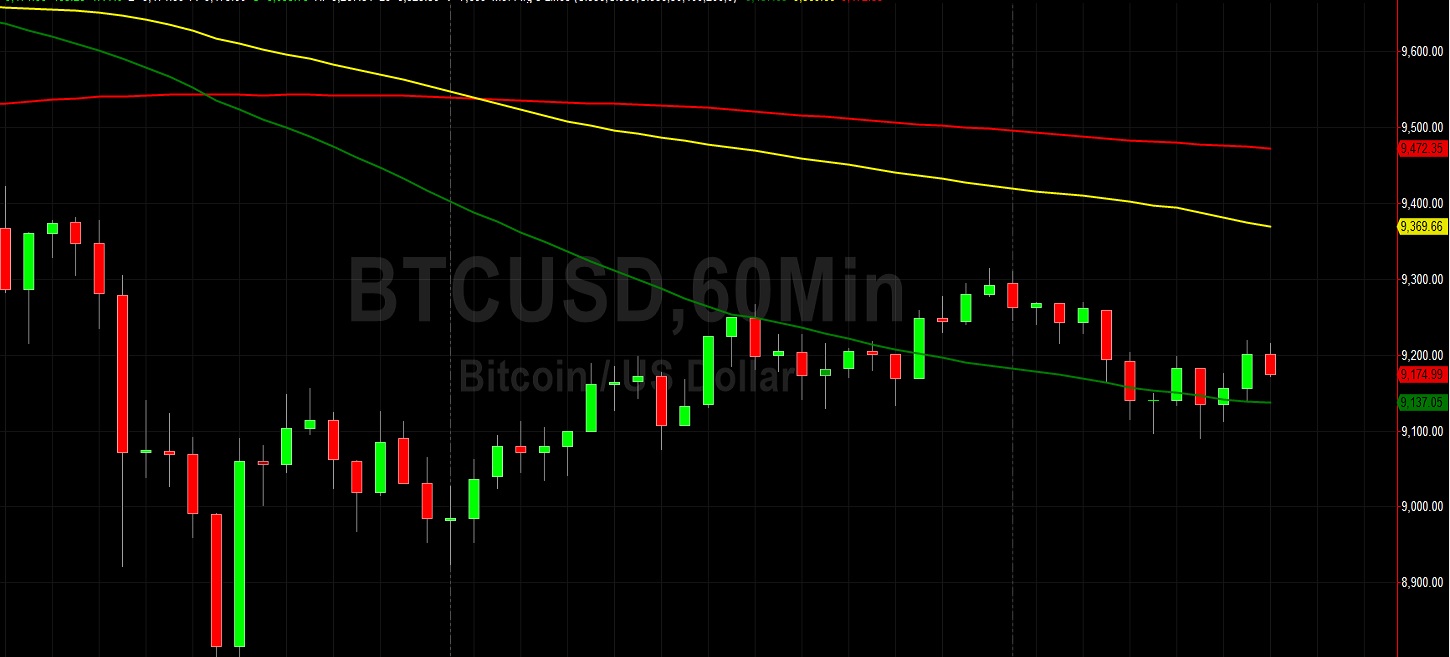
Price activity is nearest the 50-bar MA (4-hourly) at 9460.41 and the 50-bar MA (Hourly) at 9137.26.
Technical Support is expected around 8695.01/ 8540.29/ 8267.50 with Stops expected below.
Technical Resistance is expected around 10079.00/ 10316.39/ 10661.23 with Stops expected above.
On 4-Hourly chart, SlowK is Bearishly below SlowD while MACD is Bullishly above MACDAverage.
On 60-minute chart, SlowK is Bullishly above SlowD while MACD is Bearishly below MACDAverage.