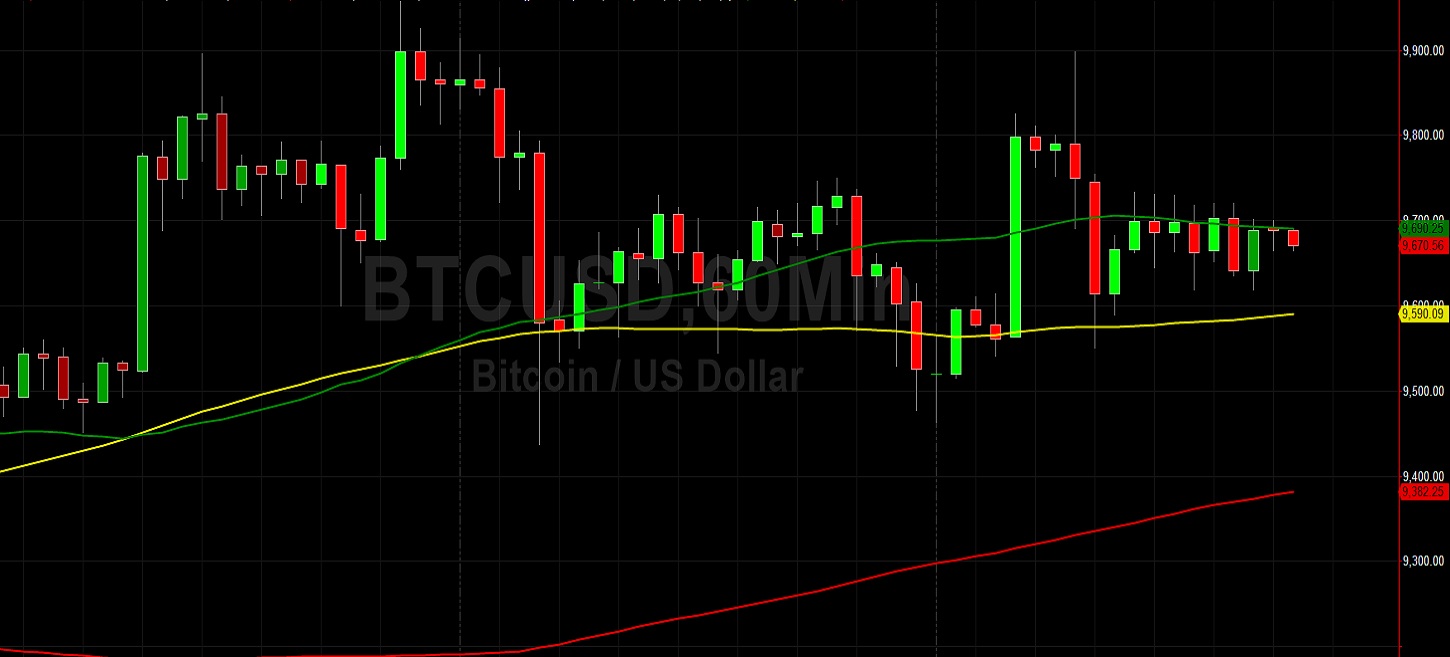
Bitcoin (BTC/USD) continued to trade sideways early in today’s Asian session as the pair moved to the 9709.19 area after trading as high as the 9898.00 area during yesterday’s European session and trading as low as the 9614.30 area during yesterday’s European session. After peaking around the 9957.25 area earlier this week, the pair came off to the 9436.97 level, right around the 38.2% retracement of the recent depreciation from 9943.93 to 9120.00. Despite an acute downward move from the 10079 area just over one week ago, BTC/USD has been steadily bid higher from the 3858 area in March following its rapid descent from the 10522.51 area in February. An important technical level that traders continue to observe is the 9214.67 area, a downside price objective related to selling pressure that emerged around the 10522.51 level. Above current market activity, traders are monitoring upside price objectives including the 9982.41, 10079, 10316.39, 10522.51, and 10661.23 areas.
Several Stops were elected during this month’s sharp move lower, including below retracement levels that include the 9223.97, 8695.01, and 8267.50 levels. Stops were below downside price objectives related to the recent 10079 selling pressure, and these levels include the 9854.42, 8896.80, 8388.32, and 8201.29 levels. Traders will continue to pay very close attention to these levels when price activity tests them. Following the sharp move lower, longer-term BTC/USD bears are eyeing the 5165.19 area as a downside price objective, and another downside price objective that has become technically significant as a result of the pullback is the 6068.39 level. Below current market activity, traders will be monitoring the 7967.33, 7610.66, 7423.22, and 7169.35 levels. Chartists are observing that the 50-bar MA (4-hourly) continues to bullishly indicate above the 100-bar MA (4-hourly) and 200-bar MA (4-hourly). Also, the 50-bar MA (hourly) is bullishly indicating above the 100-bar MA (hourly) and the 200-bar MA (hourly).
Price activity is nearest the 50-bar MA (4-hourly) at 9388.86 and the 50-bar MA (Hourly) at 9690.35.
Technical Support is expected around 9223.97/ 9028.89/ 8695.01 with Stops expected below.
Technical Resistance is expected around 10079.00/ 10316.39/ 10661.23 with Stops expected above.
On 4-Hourly chart, SlowK is Bearishly below SlowD while MACD is Bearishly below MACDAverage.
On 60-minute chart, SlowK is Bullishly above SlowD while MACD is Bearishly below MACDAverage.