Bitcoin (BTC/USD) managed to reclaim some losses early in today’s Asian session as the pair traded as high as the 8840.04 area after precipitously declining during yesterday’s Asian session, trading as low as the 8106.70 area following its peak around the 10079 area late last week. Several Stops were elected during the sharp move lower, including below retracement levels that include the 9223.97, 8695.01, and 8267.50 levels. Additional Stops were triggered below downside price objectives related to the 10079 selling pressure, and these levels include the 9854.42, 8896.80, 8388.32, and 8201.29 levels. Following the sharp move, longer-term BTC/USD bears are eyeing the 5165.19 area as a downside price objective.
Another downside price objective that has become technically significant as a result of the pullback is the 6068.39 level. During the pair’s retracement higher, traders will pay close attention to see how the pair reacts around additional key levels including the 9082.20, 9214.67, 9362.24, 9575.05, 9802.00, 9867.37, and 9948.26 levels, areas where Stops were recently elected. Below current market activity, traders will be monitoring the 7967.33, 7610.66, 7423.22, and 7169.35 levels. Chartists are observing that the 50-bar MA (4-hourly) continues to bullishly indicate above the 100-bar MA (4-hourly) and 200-bar MA (4-hourly). Also, the 50-bar MA (hourly) has bearishly crossed below the 100-bar MA (hourly) and continues to indicate above the 200-bar MA (hourly).
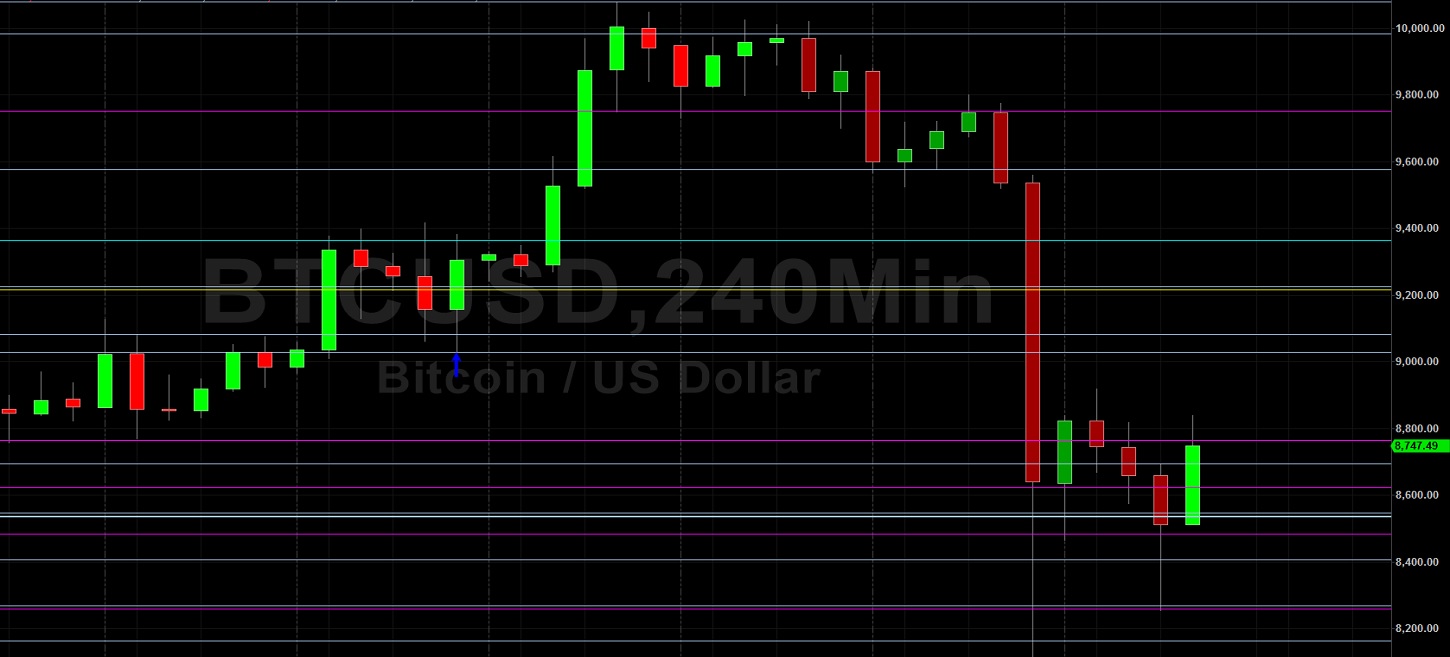
Price activity is nearest the 100-bar MA (4-hourly) at 8652.30 and the 200-bar MA (Hourly) at 9197.36.
Technical Support is expected around 7939.99/ 7311.03/ 6456.00 with Stops expected below.
Technical Resistance is expected around 9223.97/ 9575.05/ 9750.91 with Stops expected above.
On 4-Hourly chart, SlowK is Bearishly below SlowD while MACD is Bearishly below MACDAverage.
On 60-minute chart, SlowK is Bullishly above SlowD while MACD is Bullishly above MACDAverage.