Bitcoin (BTC/USD) continued to fade lower early in today’s Asian session as the pair failed to sustain a move higher to the 9594.99 area during yesterday’s European session, just below the 9613.54 area that represents the 76.4% retracement of the depreciation from 10079.00 to 8106.70. Some upward buying pressure emerged around the 9242.11 area during the past few sessions, an area that represents the 38.2% retracement of the recent appreciation from 8106.70 to 9943.93. Likewise, some selling pressure emerged around the 9531.97 area during yesterday’s North American session, a level that represents the 50% retracement of the recent depreciation from 9943.93 to 9120.00. Several Stops were elected during last weekend’s sharp move lower, including below retracement levels that include the 9223.97, 8695.01, and 8267.50 levels.
Stops were triggered last week below downside price objectives related to the recent 10079 selling pressure, and these levels include the 9854.42, 8896.80, 8388.32, and 8201.29 levels. Traders will continue to pay very close attention to these levels when price activity tests them. Following the sharp move lower, longer-term BTC/USD bears are eyeing the 5165.19 area as a downside price objective. Another downside price objective that has become technically significant as a result of the pullback is the 6068.39 level. Below current market activity, traders will be monitoring the 7967.33, 7610.66, 7423.22, and 7169.35 levels. Chartists are observing that the 50-bar MA (4-hourly) continues to bullishly indicate above the 100-bar MA (4-hourly) and 200-bar MA (4-hourly). Also, the 50-bar MA (hourly) is bullishly indicating above the 100-bar MA (hourly) and 200-bar MA (hourly).
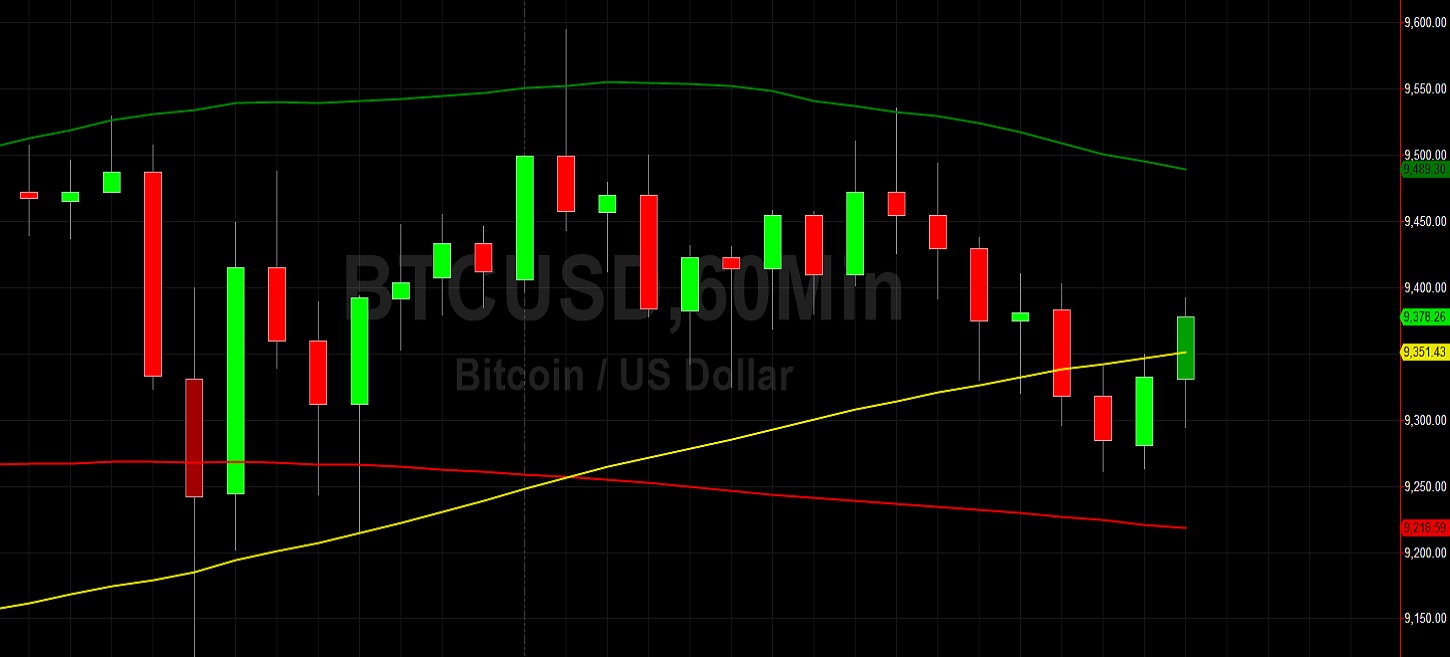
Price activity is nearest the 100-bar MA (4-hourly) at 9073.21 and the 50-bar MA (Hourly) at 9498.48.
Technical Support is expected around 9223.97/ 9028.89/ 8695.01 with Stops expected below.
Technical Resistance is expected around 10079.00/ 10316.39/ 10661.23 with Stops expected above.
On 4-Hourly chart, SlowK is Bearishly below SlowD while MACD is Bullishly above MACDAverage.
On 60-minute chart, SlowK is Bullishly above SlowD while MACD is Bearishly below MACDAverage.