Bitcoin (BTC/USD) continued its rangebound trading patterns early in today’s Asian session as the pair continued to orbit the psychologically-important 9000 figure after trading as low as the 8533.98 area during yesterday’s European session, right around the 8537.05 level that represents an upside price objective related to buying pressure that originated around the 3858.00 area in March. Stops were reached below the 8659.91 level during the move lower, an area that represents the 23.6% retracement of the recent depreciation from 9478.66 to 8407.00. Bids later emerged around the 8659.91 area during yesterday’s North American session, signaling the short-term technical significance of this level. Large Stops were elected last week above several important levels including the 9362.24, 9214.67, 9082.20, 8763.40, 8405.58, 8162.36, 7832.92, and 7751.67 areas. Some of these areas are upside price objectives related to the buying activity that originated around 3858 and other levels, while other areas were downside price objectives related to selling pressure that commenced around the 9214.67 level.
If BTC/USD is able to resume its upward trajectory, the traders will closely monitor additional upside price objectives around the 9575.05, 9750.51, and 9982.41 levels. When BTC/USD pulls back from current price activity, traders will pay close attention to some areas of potential technical support, including the 8324.00, 7967.33, 7610.66, 7423.22, and 7169.35 levels. Beyond these areas, traders will also pay close attention to levels including the 6959, 6767, 6403, 6383, 6291, and 6122 areas. Chartists are observing that the 50-bar MA (4-hourly) continues to indicate above the 100-bar MA (4-hourly). Also, the 50-bar MA (hourly) continues to indicate above the 100-bar MA (hourly), and continues to indicate above the 200-bar MA (hourly).
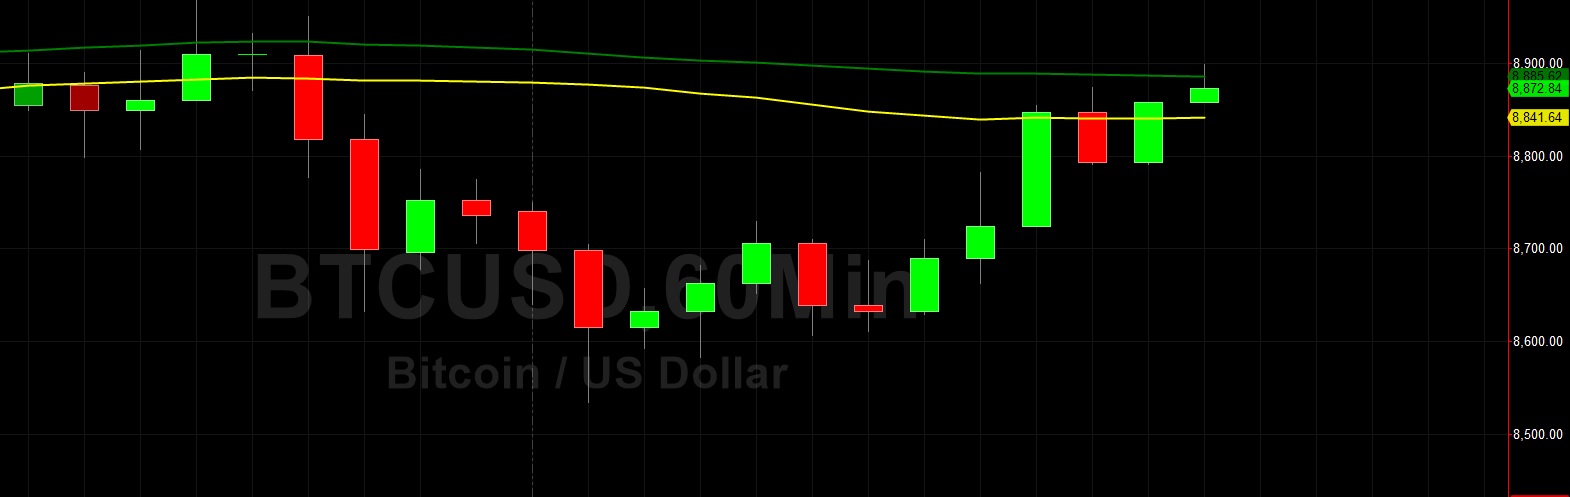
Price activity is nearest the 50-bar MA (4-hourly) at 8431.58 and the 100-bar MA (Hourly) at 8840.33.
Technical Support is expected around 8324.00/ 7967.33/ 7610.66 with Stops expected below.
Technical Resistance is expected around 9575.05/ 9750.51/ 9982.41 with Stops expected above.
On 4-Hourly chart, SlowK is Bullishly above SlowD while MACD is Bearishly below MACDAverage.
On 60-minute chart, SlowK is Bullishly above SlowD while MACD is Bullishly above MACDAverage.