Bitcoin price surges towards the Halving event

The bitcoin halving is a phenomenon coming that will affect the entire crypto market. Bitcoin just hit the $10,000 mark crossing its highest point since February. As we can see, the market has been super bullish lately gaining an impressive $13 billion in market capitalization in the past 24 hours. Bitcoin is now up 40% for its YTD performance.
With just 4 days left, the Bitcoin halving is approaching fast, so we decided to take a closer look at what we can expect and some interesting on-chain key data points.

Before we go deep into the analysis, let's do a quick recap on the halving. Approximately on May 11, the number of bitcoins (BTC) entering circulation every 10 minutes will drop by half, from 12.5 to 6.25. This only happens once every 4 years and has happened twice before.
To have some context, after the previous halving we saw a price correction followed by a bull run a few months later. So let's have a closer look on what we can expect now.
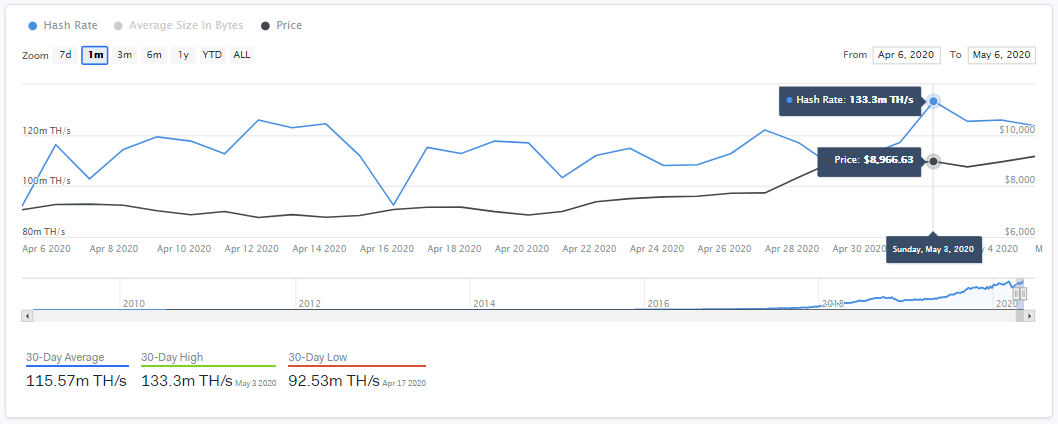
1) The Hash Rate is increasing.
Hash Rate is the speed at which a mining machine is operating to solve the mathematical puzzle that “solves” and essentially validates a block. The figure shown is the estimated aggregate computational power (measured in Terahash per second) provided by miners to operate a given network. As the Halving approaches, the Bitcoin Hash Rate hits a 30-day high of 133.3m TH/s. This mark represents a 75% increase from the YTD low on March 25 of 75.43m TH/s.
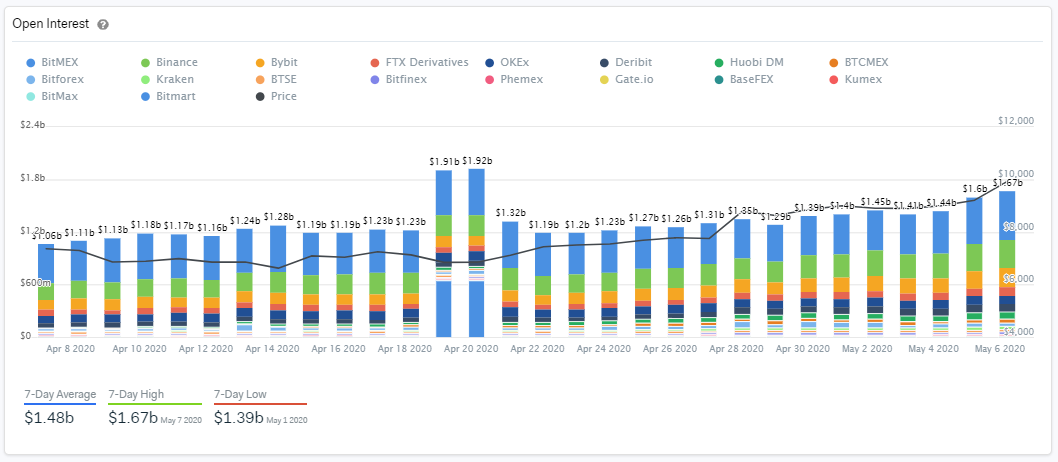
2) Perpetual Swaps Open Interest is on the Rise.
When Price and Open Interest are both on the rise it usually represents a believe by the market that a bullish trend will be sustained. Bitcoin Perpetual Swaps Open Interest has been on the rise for the last 3 days reaching $1.67b on May 7th, a 7-day high.
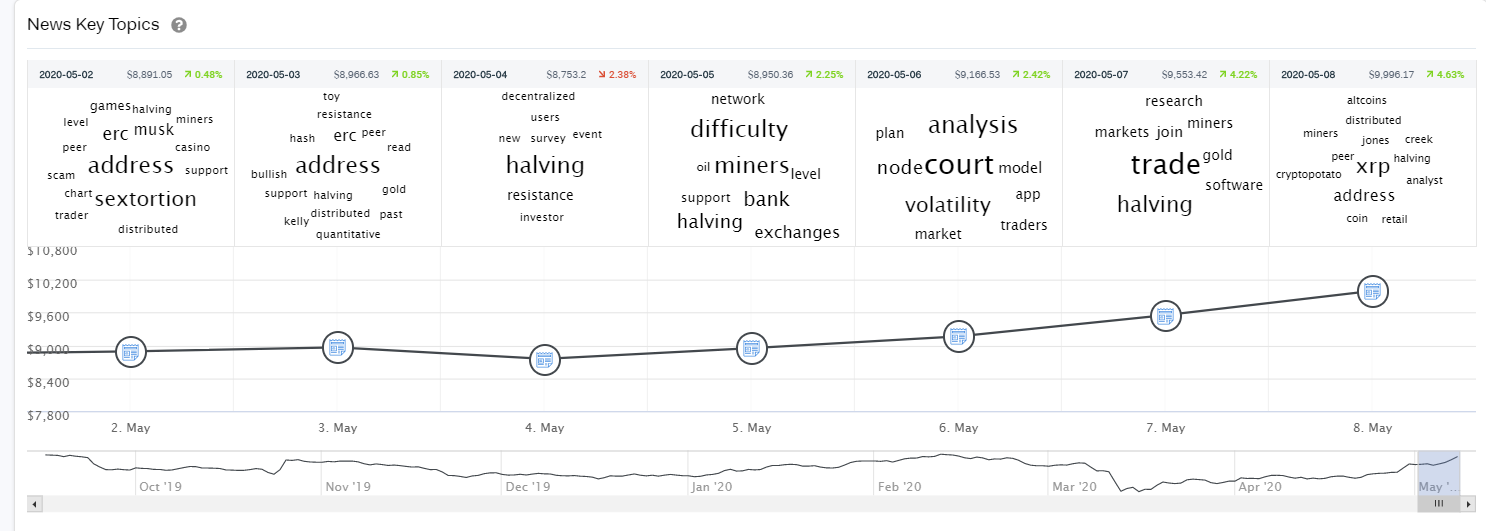
3) What social media tells us about the halving.
We can see that interest in BTC within social media platforms is actually going through the roof. Some of IntoTheBlock’s Social indicators reveal how News Key Topics and Google Search trends are soaring in interest for the halving as price rises.
4) Bitcoin Price Analysis
IntoTheBlock´s In-Out Money Around the Current Price (IOMAP) uses machine learning to identify the ten most relevant clusters of investor positions at a range of plus-minus 15% of the current price.
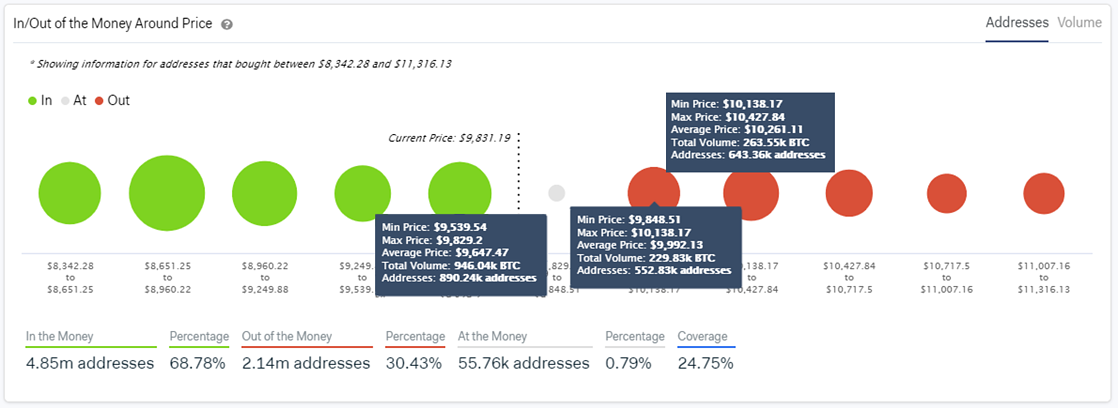
At the moment of writing, the price of Bitcoin is $9,950 and it's up 11,5% during the last 7 days. Using this indicator, we see that there are 552k addresses with positions around the $9,999 mark, this could represent the next level of resistance for the Bitcoin price to go over $10,000. Looking at the IOMAP from a volume perspective, we see that those 552k addresses at the level of $9,848 to $10,138 hold almost 230 thousand BTC, which is not a sizable volume.
If Bitcoin breaks through the $10,138 mark, the next level of resistance would be between $10,138 and 10,427$, in which 646.36k addresses hold 263k BTC. This is a slightly bigger volume than the previous level of resistance. If Bitcoin gets passed that level, he could keep going higher up to $11,000 without much resistance.
But what if the price of Bitcoin starts declining? The IOMAP analysis reveals that BTC has a strong support level at the range of $9,539 to $9,829, where almost 900 thousand addresses bought 946 thousand BTC.
While the volatility and hype continue to rise, some of these valuable data points show different views and perspectives to better understand and analyze the bitcoin price.
