Ethereum (ETH/USD) pared some intraday gains during today’s North American session as the pair moved back to the 206.85 level after trading as high as the 211.21 area during today’s European session. The 211.34 area is an important technical level as it represents the 50% retracement of the recent depreciation from 227.50 to 195.17, and the pair’s inability to move above this area of technical resistance is bearish for ETH/USD in the short-term. Another important technical level in this range is the 208.16 area, representing the 23.6% retracement of the recent appreciation from 195.17 to 212.17, and traders kept the pair bid around this level. Stops were elected last week around multiple important technical levels, including the 213.05, 206.29, 199.16, and 198.09 levels, and traders will pay close attention to these levels when the market revisits them.
Above current price activity, traders will pay very close attention to the 232.88 and 242.09 areas, additional upside price objectives related to the 90.00 level, with Stops likely to be decent above the 232.88 area. When ETH/USD comes off, traders will pay close attention to levels including the 187.79, 178.42, and 166.82 levels. Chartists are observing that the 50-bar MA (4-hourly) bullishly continues to indicate above the 100-bar MA (4-hourly) and 200-bar MA (4-hourly). Also, the 50-bar MA (hourly) bearishly crossed below the 200-bar MA (hourly), and continues to indicate below the 100-bar MA (hourly).
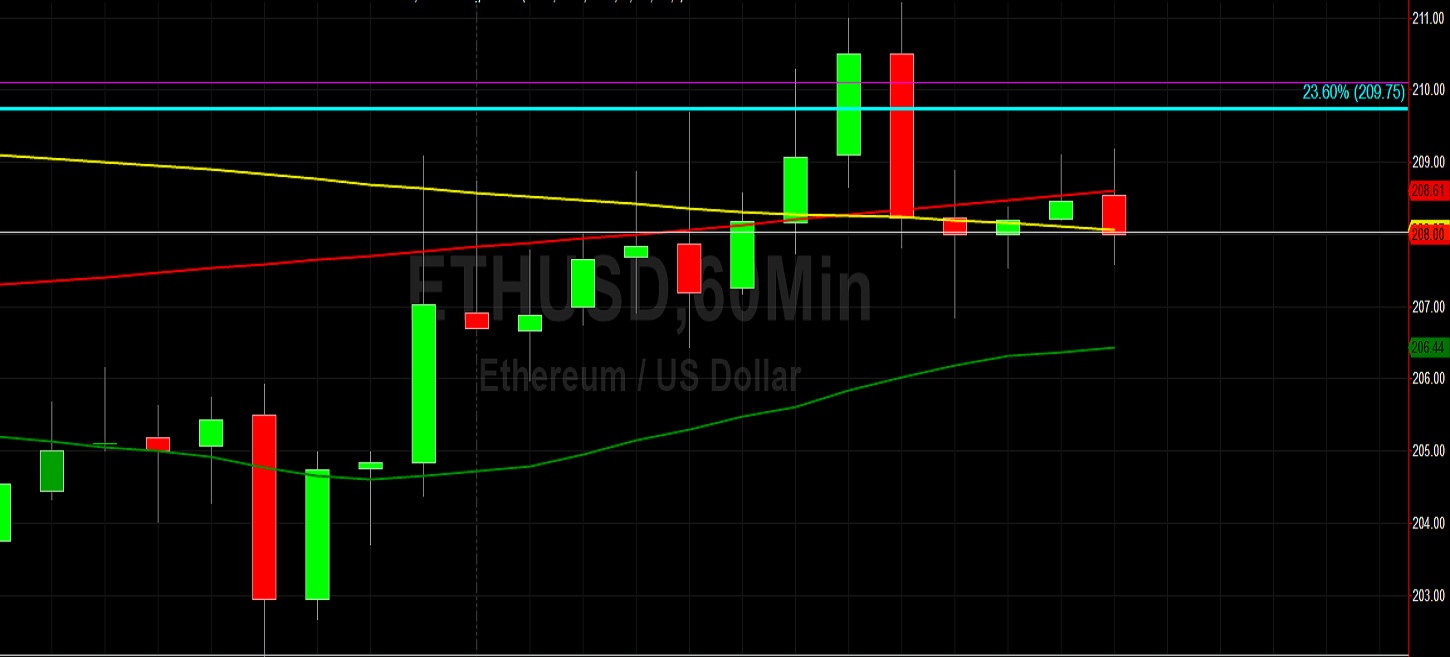
Price activity is nearest the 50-bar MA (4-hourly) at 208.85 and the 100-bar MA (Hourly) at 208.07.
Technical Support is expected around 193.00/ 189.60/ 184.01 with Stops expected below.
Technical Resistance is expected around 227.50/ 232.88/ 242.09 with Stops expected above.
On 4-Hourly chart, SlowK is Bearishly below SlowD while MACD is Bullishly above MACDAverage.
On 60-minute chart, SlowK is Bearishly below SlowD while MACD is Bullishly above MACDAverage.